Assume that you are also considering to invest in the stock of BHP Billiton. You have limited fund to invest and therefore, you can invest in either of the company (BHP Billiton or your allocated company). Compare your companys financial statements, and performance, with those of the BHP Billiton. If you were making a decision to invest in one of the two companies, which company would you choose? Discuss. [In evaluating and comparing the companies, use appropriate ratios and other analysis. Provide clear justification as to why you believe your approach to evaluation is appropriate for investment decision purpose].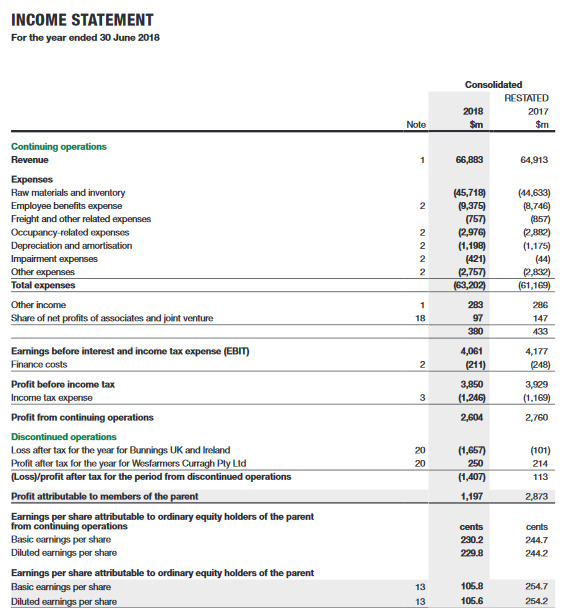
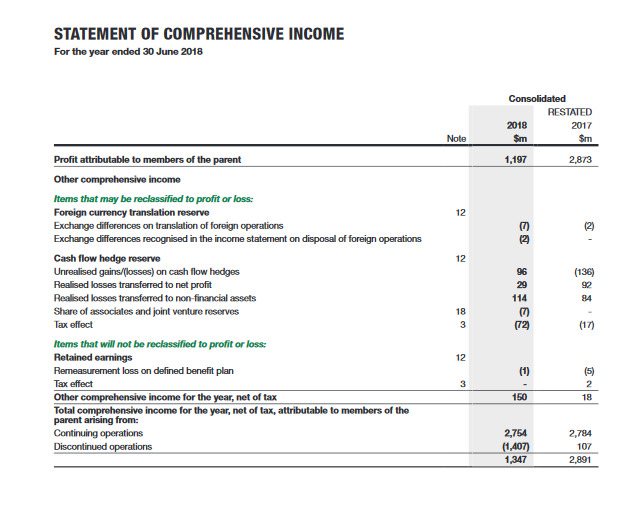
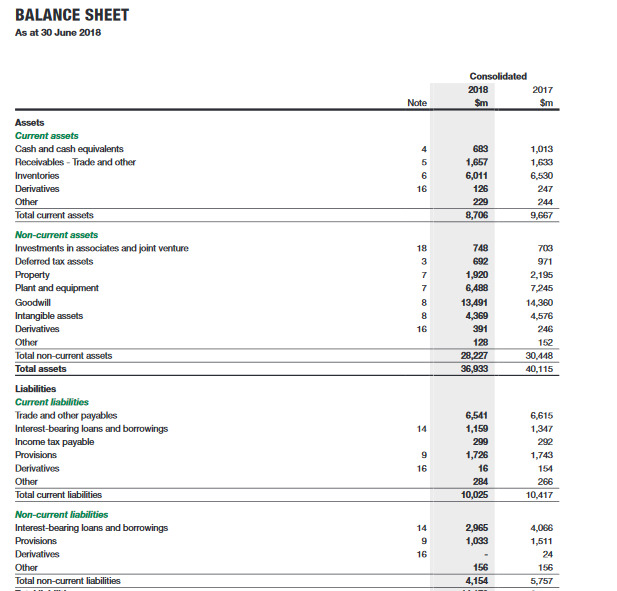
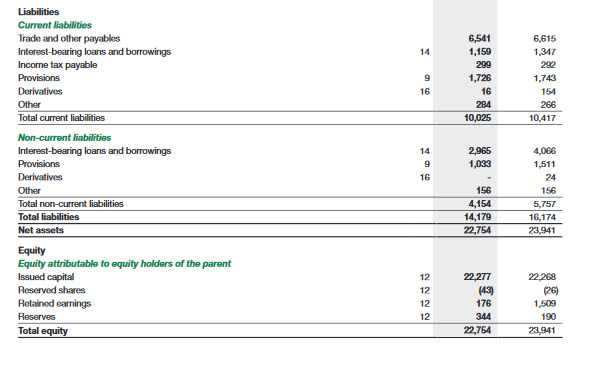
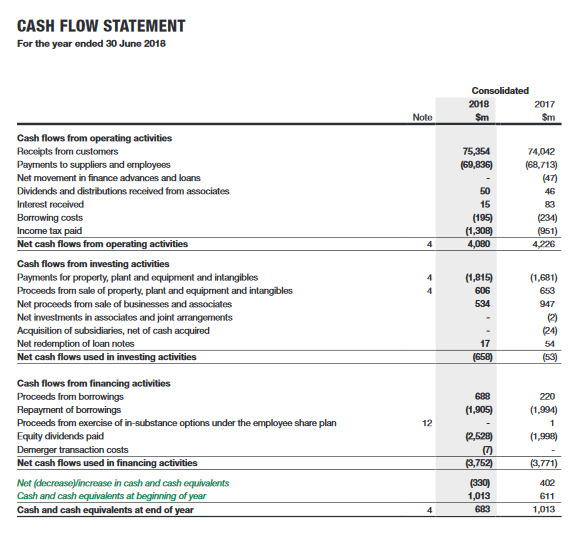
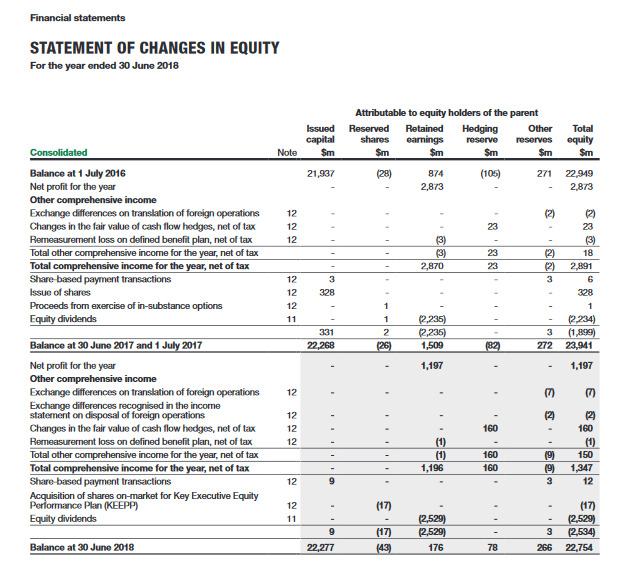
INCOME STATEMENT For the year ended 30 June 2018 Consolidated RESTATED 2018 2017 Sim Note $m 66,883 64,913 (44,633) (8.746) Continuing operations Revenue Expenses Raw materials and inventory Employee benefits expense Freight and other related expenses Occupancy-related expenses Depreciation and amortisation Impairment expenses Other expenses Total expenses (45,718) (9,375) (757) (2,976) (1,198) (421) (2,757) (63,202) 2,882) (1.175) (44) (2,832) (61,169) 283 296 Other income Share of net profits of associates and joint venture 97 380 147 433 Earnings before interest and income tax expense (EBIT) Finance costs 4,061 (211) 2 4,177 (248) Profit before income tax Income tax expense 3,850 (1,246) 2,604 3,929 (1,169) 2,760 Profit from continuing operations Discontinued operations Loss after tax for the year for Bunnings UK and Ireland Profit after tax for the year for Wesfarmers Curragh Ply Ltd (Loss) profit after tax for the period from discontinued operations (1,657) 250 (101) 214 113 (1,407) 1,197 Profit attributable to members of the parent 2,873 cents cents 230.2 229.8 244.7 2442 Earnings per share attributable to ordinary equity holders of the parent from continuing operations Basic earnings per share Diluted earnings per share Earnings per share attributable to ordinary equity holders of the parent Basic earnings per share Diluted earnings per share 105.8 106.6 254.7 254.2 STATEMENT OF COMPREHENSIVE INCOME For the year ended 30 June 2018 Consolidated RESTATED 2018 2017 $m Note $m 1,197 2,873 Profit attributable to members of the parent Other comprehensive income items that may be reclassified to profit or loss: Foreign currency translation reserve Exchange differences on translation of foreign operations Exchange differences recognised in the income statement on disposal of foreign operations Cash flow hedge reserve Unrealised gains/(losses) on cash flow hedges Realised losses transferred to net profit Realised losses transferred to non financial assets Share of associates and joint venture reserves Tax effect Items that will not be reclassified to profit or loss: Retained earnings Remeasurement loss on defined benefit plan Tax effect Other comprehensive income for the year, net of tax Total comprehensive income for the year, net of tax, attributable to members of the parent arising from: Continuing operations Discontinued operations 150 2,754 (1,407) 1,347 2,784 107 2,891 BALANCE SHEET As at 30 June 2018 Consolidated 2018 Sm 2017 $m Note Assets Current assets Cash and cash equivalents Receivables - Trade and other Inventories Derivatives Other 683 1,657 6,011 125 1,013 1,633 6,530 247 244 9,667 229 8,706 Total current assets Non-current assets Investments in associates and joint venture Deferred tax assets Property Plant and equipment Goodwill Intangible assets Derivatives Other Total non-current assets Total assets 748 692 1,920 6,488 13,491 4,369 391 129 28,227 36,933 7033 971 2,195 7245 14,360 4,576 246 152 30,448 40.115 Liabilities Current liabilities Trade and other payables Interest-bearing loans and borrowings Income tax payable Provisions Derivatives Other Total current liabilities 6,541 1,159 299 1,726 6,615 1,347 292 1,743 154 16 284 10,025 266 10.417 14 2,965 1,033 4,066 1,511 9 Non-current liabilities Interest-bearing loans and borrowings Provisions Derivatives Other Total non-current liabilities 24 156 4,154 156 5,757 Liabilities Current liabilities Trade and other payables Interest-bearing loans and borrowings Income tax payable Provisions Derivatives Other Total current liabilities 6,541 1,159 299 1,726 16 284 10,025 6,615 1,347 292 1,743 154 266 10,417 2,965 1,033 Non-current liabilities Interest-bearing loans and borrowings Provisions Derivatives Other Total non-current liabilities Total liabilities Net assets 156 4,154 14,179 22,754 4,066 1,511 24 156 5,757 16,174 23,941 Equity Equity attributable to equity holders of the parent Issued capital Reserved shares Retained earnings Reserves Total equity 22,268 (26) 22.277 (439 176 344 22,754 1,509 190 23.941 CASH FLOW STATEMENT For the year ended 30 June 2018 Consolidated 2018 Sm 2017 Nole $m 75,354 (69,836) 74,042 (68,713) (47) Cash flows from operating activities Receipts from customers Payments to suppliers and employees Net movement in finance advances and loans Dividends and distributions received from associates Interest received Borrowing costs Income tax paid Net cash flows from operating activities 50 83 (195) (1,308) 4,080 (234) 1951) 4,226 (1,815) 606 534 (1.681) 663 Cash flows from investing activities Payments for property, plant and equipment and intangibles Proceeds from sale of property, plant and equipment and intangibles Net proceeds from sale of businesses and associates Net investments in associates and joint arrangements Acquisition of subsidiaries, net of cash acquired Net redemption of loan notes Net cash flows used in investing activities 947 (2) (24) 51 17 (658) GRS 220 (1,905) (1.994) 12.529) (1,998) Cash flows from financing activities Proceeds from borrowings Repayment of borrowings Proceeds from exercise of in-substance options under the employee share plan Equity dividends paid Demerger transaction costs Net cash flows used in financing activities Net (decrease/increase in cash and cash equivalents Cash and cash equivalents at beginning of year Cash and cash equivalents at end of year (3,752 (3.771) 402 (330) 1,013 683 611 1.013 Financial statements STATEMENT OF CHANGES IN EQUITY For the year ended 30 June 2018 Issued capital Sm Attributable to equity holders of the parent Reserved Retained Hedging Other shares earnings reserve reserves Sm Sm Sm Sm Total equity Sm Consolidated Note 21,937 (28) (105) 874 2,873 271 - 22,949 2,873 12 12 12 Balance at 1 July 2016 Net profit for the year Other comprehensive income Exchange differences on translation of foreign operations Changes in the fair value of cash flow hedges, net of tax Remeasurement loss on defined benefit plan, net of tax Total other comprehensive income for the year, net of tax Total comprehensive income for the year, net of tax Share based payment transactions Issue of shares Proceeds from exercise of in-substance options Equity dividends - - - - - 3) 2,870 (2) 18 (2) 2,891 36 123 12 328 12 - 1 2 3312 22,268 .235) 2,235) 1,509 - 3 272 - (82) 2.234) (1,899) 23,941 Balance at 30 June 2017 and 1 July 2017 (26) 1,197 - 1,197 12 12 12 12 - (2 160 Net profit for the year Other comprehensive income Exchange differences on translation of foreign operations Exchange differences recognised in the income statement on disposal of foreign operations Changes in the fair value of cash flow hedges, net of tax Remeasurement loss on defined benefit plan, net of tax Total other comprehensive income for the year, net of tax Total comprehensive income for the year, net of tax Share based payment transactions Acquisition of shares on-market for Key Executive Equity Performance Plan (KEEPP) Equity dividends 12 (1) 1,196 - 160 19 150 (9) 1,347 312 (17) - (17) (43) - . 3 266 2,529) (2,529) 176 9 22,277 (17) (2.529) 2,534 22,754 - 78 Balance at 30 June 2018 INCOME STATEMENT For the year ended 30 June 2018 Consolidated RESTATED 2018 2017 Sim Note $m 66,883 64,913 (44,633) (8.746) Continuing operations Revenue Expenses Raw materials and inventory Employee benefits expense Freight and other related expenses Occupancy-related expenses Depreciation and amortisation Impairment expenses Other expenses Total expenses (45,718) (9,375) (757) (2,976) (1,198) (421) (2,757) (63,202) 2,882) (1.175) (44) (2,832) (61,169) 283 296 Other income Share of net profits of associates and joint venture 97 380 147 433 Earnings before interest and income tax expense (EBIT) Finance costs 4,061 (211) 2 4,177 (248) Profit before income tax Income tax expense 3,850 (1,246) 2,604 3,929 (1,169) 2,760 Profit from continuing operations Discontinued operations Loss after tax for the year for Bunnings UK and Ireland Profit after tax for the year for Wesfarmers Curragh Ply Ltd (Loss) profit after tax for the period from discontinued operations (1,657) 250 (101) 214 113 (1,407) 1,197 Profit attributable to members of the parent 2,873 cents cents 230.2 229.8 244.7 2442 Earnings per share attributable to ordinary equity holders of the parent from continuing operations Basic earnings per share Diluted earnings per share Earnings per share attributable to ordinary equity holders of the parent Basic earnings per share Diluted earnings per share 105.8 106.6 254.7 254.2 STATEMENT OF COMPREHENSIVE INCOME For the year ended 30 June 2018 Consolidated RESTATED 2018 2017 $m Note $m 1,197 2,873 Profit attributable to members of the parent Other comprehensive income items that may be reclassified to profit or loss: Foreign currency translation reserve Exchange differences on translation of foreign operations Exchange differences recognised in the income statement on disposal of foreign operations Cash flow hedge reserve Unrealised gains/(losses) on cash flow hedges Realised losses transferred to net profit Realised losses transferred to non financial assets Share of associates and joint venture reserves Tax effect Items that will not be reclassified to profit or loss: Retained earnings Remeasurement loss on defined benefit plan Tax effect Other comprehensive income for the year, net of tax Total comprehensive income for the year, net of tax, attributable to members of the parent arising from: Continuing operations Discontinued operations 150 2,754 (1,407) 1,347 2,784 107 2,891 BALANCE SHEET As at 30 June 2018 Consolidated 2018 Sm 2017 $m Note Assets Current assets Cash and cash equivalents Receivables - Trade and other Inventories Derivatives Other 683 1,657 6,011 125 1,013 1,633 6,530 247 244 9,667 229 8,706 Total current assets Non-current assets Investments in associates and joint venture Deferred tax assets Property Plant and equipment Goodwill Intangible assets Derivatives Other Total non-current assets Total assets 748 692 1,920 6,488 13,491 4,369 391 129 28,227 36,933 7033 971 2,195 7245 14,360 4,576 246 152 30,448 40.115 Liabilities Current liabilities Trade and other payables Interest-bearing loans and borrowings Income tax payable Provisions Derivatives Other Total current liabilities 6,541 1,159 299 1,726 6,615 1,347 292 1,743 154 16 284 10,025 266 10.417 14 2,965 1,033 4,066 1,511 9 Non-current liabilities Interest-bearing loans and borrowings Provisions Derivatives Other Total non-current liabilities 24 156 4,154 156 5,757 Liabilities Current liabilities Trade and other payables Interest-bearing loans and borrowings Income tax payable Provisions Derivatives Other Total current liabilities 6,541 1,159 299 1,726 16 284 10,025 6,615 1,347 292 1,743 154 266 10,417 2,965 1,033 Non-current liabilities Interest-bearing loans and borrowings Provisions Derivatives Other Total non-current liabilities Total liabilities Net assets 156 4,154 14,179 22,754 4,066 1,511 24 156 5,757 16,174 23,941 Equity Equity attributable to equity holders of the parent Issued capital Reserved shares Retained earnings Reserves Total equity 22,268 (26) 22.277 (439 176 344 22,754 1,509 190 23.941 CASH FLOW STATEMENT For the year ended 30 June 2018 Consolidated 2018 Sm 2017 Nole $m 75,354 (69,836) 74,042 (68,713) (47) Cash flows from operating activities Receipts from customers Payments to suppliers and employees Net movement in finance advances and loans Dividends and distributions received from associates Interest received Borrowing costs Income tax paid Net cash flows from operating activities 50 83 (195) (1,308) 4,080 (234) 1951) 4,226 (1,815) 606 534 (1.681) 663 Cash flows from investing activities Payments for property, plant and equipment and intangibles Proceeds from sale of property, plant and equipment and intangibles Net proceeds from sale of businesses and associates Net investments in associates and joint arrangements Acquisition of subsidiaries, net of cash acquired Net redemption of loan notes Net cash flows used in investing activities 947 (2) (24) 51 17 (658) GRS 220 (1,905) (1.994) 12.529) (1,998) Cash flows from financing activities Proceeds from borrowings Repayment of borrowings Proceeds from exercise of in-substance options under the employee share plan Equity dividends paid Demerger transaction costs Net cash flows used in financing activities Net (decrease/increase in cash and cash equivalents Cash and cash equivalents at beginning of year Cash and cash equivalents at end of year (3,752 (3.771) 402 (330) 1,013 683 611 1.013 Financial statements STATEMENT OF CHANGES IN EQUITY For the year ended 30 June 2018 Issued capital Sm Attributable to equity holders of the parent Reserved Retained Hedging Other shares earnings reserve reserves Sm Sm Sm Sm Total equity Sm Consolidated Note 21,937 (28) (105) 874 2,873 271 - 22,949 2,873 12 12 12 Balance at 1 July 2016 Net profit for the year Other comprehensive income Exchange differences on translation of foreign operations Changes in the fair value of cash flow hedges, net of tax Remeasurement loss on defined benefit plan, net of tax Total other comprehensive income for the year, net of tax Total comprehensive income for the year, net of tax Share based payment transactions Issue of shares Proceeds from exercise of in-substance options Equity dividends - - - - - 3) 2,870 (2) 18 (2) 2,891 36 123 12 328 12 - 1 2 3312 22,268 .235) 2,235) 1,509 - 3 272 - (82) 2.234) (1,899) 23,941 Balance at 30 June 2017 and 1 July 2017 (26) 1,197 - 1,197 12 12 12 12 - (2 160 Net profit for the year Other comprehensive income Exchange differences on translation of foreign operations Exchange differences recognised in the income statement on disposal of foreign operations Changes in the fair value of cash flow hedges, net of tax Remeasurement loss on defined benefit plan, net of tax Total other comprehensive income for the year, net of tax Total comprehensive income for the year, net of tax Share based payment transactions Acquisition of shares on-market for Key Executive Equity Performance Plan (KEEPP) Equity dividends 12 (1) 1,196 - 160 19 150 (9) 1,347 312 (17) - (17) (43) - . 3 266 2,529) (2,529) 176 9 22,277 (17) (2.529) 2,534 22,754 - 78 Balance at 30 June 2018


