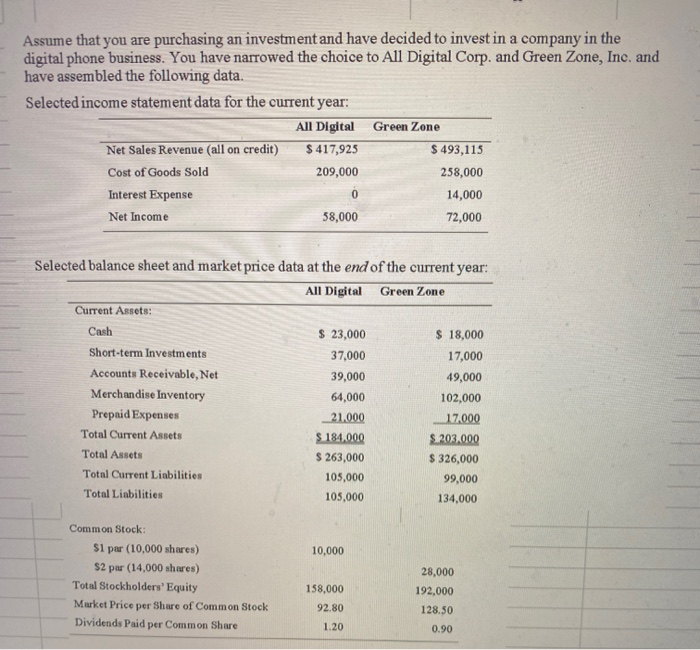
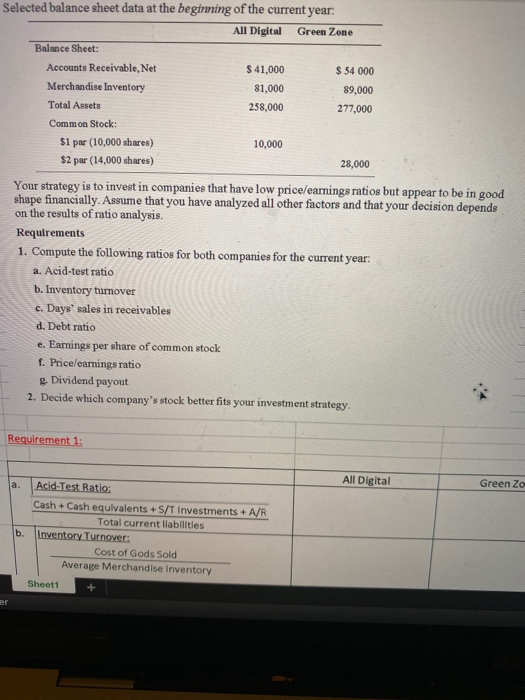
Assume that you are purchasing an investment and have decided to invest in a company in the digital phone business. You have narrowed the choice to All Digital Corp. and Green Zone, Inc. and have assembled the following data. Selected income statement data for the current year: All Digital Green Zone Net Sales Revenue (all on credit) $ 417,925 $ 493,115 Cost of Goods Sold 209,000 258,000 Interest Expense 14,000 Net Income 58,000 72,000 Selected balance sheet and market price data at the end of the current year: All Digital Green Zone Current Assets: Cash $ 23,000 $ 18,000 Short-term Investments 37,000 17,000 Accounts Receivable, Net 39,000 49,000 Merchandise Inventory 64,000 102,000 Prepaid Expenses 21.000 17.000 Total Current Assets $ 184,000 S. 203.000 Total Assets $ 263,000 $ 326,000 Total Current Liabilities 105,000 99,000 Total Liabilities 105,000 134,000 10,000 Common Stock: $1 par (10,000 shares) $2 par (14,000 shares) Total Stockholders' Equity Market Price per Share of Common Stock Dividends Paid per Common Share 158,000 92.80 28,000 192,000 128.50 0.90 1.20 Selected balance sheet data at the beginning of the current year: All Digital Green Zone Balance Sheet: Accounts Receivable, Net $ 41,000 $ 54 000 Merchandise Inventory 81,000 89,000 Total Assets 258,000 277,000 Common Stock: $1 par (10,000 shares) 10,000 $2 par (14,000 shares) 28,000 Your strategy is to invest in companies that have low price/earnings ratios but appear to be in good shape financially. Assume that you have analyzed all other factors and that your decision depends on the results of ratio analysis. Requirements 1. Compute the following ratios for both companies for the current year: a. Acid-test ratio b. Inventory turnover c. Days' sales in receivables d. Debt ratio e. Earnings per share of common stock f. Price/earnings ratio Dividend payout 2. Decide which company's stock better fits your investment strategy. Requirement 1: All Digital a. Green Zo b. Acid-Test Ratio: Cash + Cash equivalents + S/T Investments +A/R Total current liabilities Inventory Turnover: Cost of Gods Sold Average Merchandise Inventory Sheet1 er


