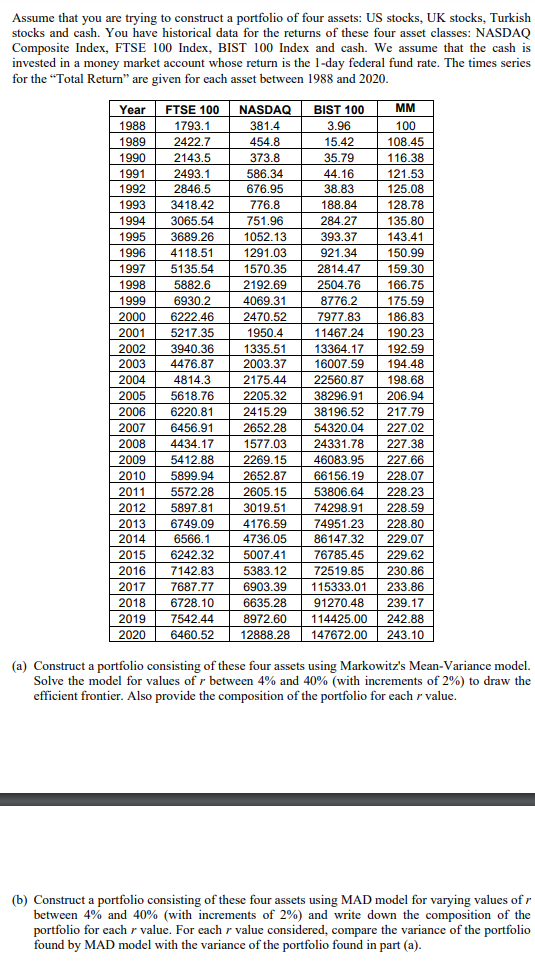
Assume that you are trying to construct a portfolio of four assets: US stocks, UK stocks, Turkish stocks and cash. You have historical data for the returns of these four asset classes: NASDAQ Composite Index, FTSE 100 Index, BIST 100 Index and cash. We assume that the cash is invested in a money market account whose return is the 1-day federal fund rate. The times series for the "Total Return" are given for each asset between 1988 and 2020. 116.38 Year 1988 1989 1990 1991 100 1992 200 1993 1994 100 1995 100 1996 1000 1997 100 1998 100 1999 2000 2000 2001 2001 2002 2004 2003 2002 2004 200 2005 2000 2006 20 2007 200 2008 . 2009 2010 201T 2011 2012 2013 2013 2014 201 2015 2014 2016 19 2011 2017 2018 2010 2019 2020 FTSE 100 1793.1 2422.7 2143.5 2143.2 2493.1 2846.5 wo 3418.42 200 3065.54 000 3689.26 03. 4118.51 10.0! 5135.54 JOOZ.C 5882.6 OSS.. 6930.2 6222.46 64.14 21. 5217.35 3940.36 U. 4476.87 2011 4814.3 5618.76 6220.81 6456.91 w 4434.17 NASDAQ 381.4 454.8 373.8 586.34 40 676.95 zze 776.8 ze 751.96 on 1052.13 100 1291.03 1570.35 2192.69 16. 4069.31 Wow! 2470.52 10 1950.4 100. TODO. 1335.51 2003.37 wy 2175.44 2205.32 were 2415.29 2652.28 Tube 1577.03 2269.15 2652.87 2605.15 3019.51 4176.59 4736.05 0. 5007.41 . 00 5383.12 6903.39 6635.28 BIST 100 MM 3.96 100 15.42 108.45 35.79 44.16 121.53 Jo 38.83 125.08 2002 188.84 128.78 2011 284.27 135.80 1. www 393.37 143.41 .. 921.34 150.99 T. 2814.47 159.30 11.7! 10. 2504.76 166.75 2004.19 22 8776.2 175.59 . 1. 7977.83 186.83 100.00 T101.24 11467.24 100.20 190.23 13364.17 192.59 1000 104140 16007.59 194.48 1000 22560.87 198.68 2000 wer 38296.91 206.94 -0.2! wi 38196.52 217.79 1 54320.04 227.02 1 a 24331.78 227.38 46083.95 66156.19 228.07 53806.64 228.23 33000.09 228.25 74298.91 228.59 74951.23 86147.32 229.07 260.0 76785.45 229.62 . 450.00 72519.85 230.86 200.00 115333.01 233.86 200.00 91270.48 239.17 114425.00 242.88 147672.00 243.10 5412.88 227.66 228.80 5899.94 5572.28 5897.81 6749.09 6566.1 0. 6242.32 7142.83 7687.77 6728.10 7542.44 6460.52 8972.60 12888.28 (a) Construct a portfolio consisting of these four assets using Markowitz's Mean-Variance model. Solve the model for values of r between 4% and 40% (with increments of 2%) to draw the efficient frontier. Also provide the composition of the portfolio for each r value. (b) Construct a portfolio consisting of these four assets using MAD model for varying values of r between 4% and 40% (with increments of 2%) and write down the composition of the portfolio for each r value. For each r value considered, compare the variance of the portfolio found by MAD model with the variance of the portfolio found in part (a). Assume that you are trying to construct a portfolio of four assets: US stocks, UK stocks, Turkish stocks and cash. You have historical data for the returns of these four asset classes: NASDAQ Composite Index, FTSE 100 Index, BIST 100 Index and cash. We assume that the cash is invested in a money market account whose return is the 1-day federal fund rate. The times series for the "Total Return" are given for each asset between 1988 and 2020. 116.38 Year 1988 1989 1990 1991 100 1992 200 1993 1994 100 1995 100 1996 1000 1997 100 1998 100 1999 2000 2000 2001 2001 2002 2004 2003 2002 2004 200 2005 2000 2006 20 2007 200 2008 . 2009 2010 201T 2011 2012 2013 2013 2014 201 2015 2014 2016 19 2011 2017 2018 2010 2019 2020 FTSE 100 1793.1 2422.7 2143.5 2143.2 2493.1 2846.5 wo 3418.42 200 3065.54 000 3689.26 03. 4118.51 10.0! 5135.54 JOOZ.C 5882.6 OSS.. 6930.2 6222.46 64.14 21. 5217.35 3940.36 U. 4476.87 2011 4814.3 5618.76 6220.81 6456.91 w 4434.17 NASDAQ 381.4 454.8 373.8 586.34 40 676.95 zze 776.8 ze 751.96 on 1052.13 100 1291.03 1570.35 2192.69 16. 4069.31 Wow! 2470.52 10 1950.4 100. TODO. 1335.51 2003.37 wy 2175.44 2205.32 were 2415.29 2652.28 Tube 1577.03 2269.15 2652.87 2605.15 3019.51 4176.59 4736.05 0. 5007.41 . 00 5383.12 6903.39 6635.28 BIST 100 MM 3.96 100 15.42 108.45 35.79 44.16 121.53 Jo 38.83 125.08 2002 188.84 128.78 2011 284.27 135.80 1. www 393.37 143.41 .. 921.34 150.99 T. 2814.47 159.30 11.7! 10. 2504.76 166.75 2004.19 22 8776.2 175.59 . 1. 7977.83 186.83 100.00 T101.24 11467.24 100.20 190.23 13364.17 192.59 1000 104140 16007.59 194.48 1000 22560.87 198.68 2000 wer 38296.91 206.94 -0.2! wi 38196.52 217.79 1 54320.04 227.02 1 a 24331.78 227.38 46083.95 66156.19 228.07 53806.64 228.23 33000.09 228.25 74298.91 228.59 74951.23 86147.32 229.07 260.0 76785.45 229.62 . 450.00 72519.85 230.86 200.00 115333.01 233.86 200.00 91270.48 239.17 114425.00 242.88 147672.00 243.10 5412.88 227.66 228.80 5899.94 5572.28 5897.81 6749.09 6566.1 0. 6242.32 7142.83 7687.77 6728.10 7542.44 6460.52 8972.60 12888.28 (a) Construct a portfolio consisting of these four assets using Markowitz's Mean-Variance model. Solve the model for values of r between 4% and 40% (with increments of 2%) to draw the efficient frontier. Also provide the composition of the portfolio for each r value. (b) Construct a portfolio consisting of these four assets using MAD model for varying values of r between 4% and 40% (with increments of 2%) and write down the composition of the portfolio for each r value. For each r value considered, compare the variance of the portfolio found by MAD model with the variance of the portfolio found in part (a)


