Question
Assume that you recently graduated and landed a job as a financial planner with Cicero Services, an investment advisory company. Your first client recently inherited
Assume that you recently graduated and landed a job as a financial planner with Cicero Services, an investment advisory company. Your first client recently inherited some assets and has asked you to evaluate them. The client has $2 million invested in the stock of Blandy, Inc., a company that produces meat-and-potatoes frozen dinners. Blandys slogan is Solid food for shaky times.
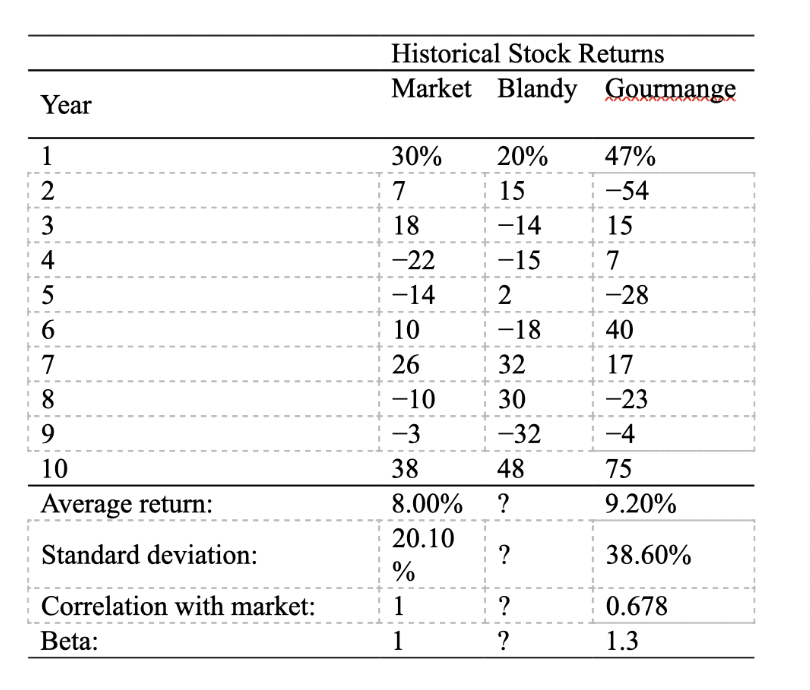
Unfortunately, Congress and the President are engaged in an acrimonious dispute over the budget and the debt ceiling. The outcome of the dispute, which will not be resolved until the end of the year, will have a big impact on interest rates one year from now. You have also gathered historical returns as follows for the past 10 years for Blandy, Gourmange Corporation (a producer of gourmet specialty foods), and the stock market. The risk-free rate is 4% and the market average return is 8%.
Based on the information provided, complete the following:
Suppose an investor starts with a portfolio consisting of one randomly selected stock.
- How to measure the risk and return given different scenarios for a particular stock? - What are the criteria the investor should consider to choose a single stock to invest?
- As more and more randomly selected stocks are added to the portfolio, what happens to the portfolios risk?
- How does correlation affect your portfolio return and risk?
- Calculate the numbers with questions marks and the estimated correlation between Blandy and Gourmange using the data in the above Table. Does this explain why the portfolio standard deviation was less than Blandys standard deviation?
- If you decided to hold a one-stock portfolio and consequently were exposed to more risk than diversified investors, could you expect to be compensated for all of your risk; that is, could you earn a risk premium on that part of your risk that you could have eliminated by diversifying?
- According to the Capital Asset Pricing Model, what measures the amount of risk that an individual stock contributes to a well-diversified portfolio?

Step by Step Solution
There are 3 Steps involved in it
Step: 1

Get Instant Access to Expert-Tailored Solutions
See step-by-step solutions with expert insights and AI powered tools for academic success
Step: 2

Step: 3

Ace Your Homework with AI
Get the answers you need in no time with our AI-driven, step-by-step assistance
Get Started


