Question
Assume that you recently graduated with a major in finance. You just landed a job as a financial planner with Merrill Finch Inc., a large
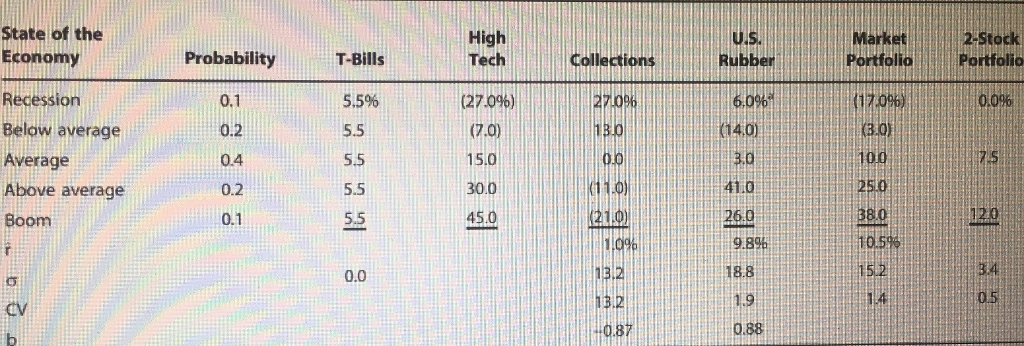
Assume that you recently graduated with a major in finance. You just landed a job as a financial planner with Merrill Finch Inc., a large financial services corporation. Your first assignment is to invest $100,000 for a client. Because the funds are to be invested in a business at the end of 1 year, you have been instructed to plan for a 1-year holding period. Further, your boss has restricted you to the investment alternatives in the following table, shown with their probabilities and associated outcomes. (For now, disregard the items at the bottom of the data; you will fill in the blanks later.)

Note: The estimated returns of U.S. Rubber do not always move in the same direction as the overall economy. For example, when the economy is below average, consumers purchase fewer tires than they would if the economy was stronger. However, if the economy is in a flat-out recession, a large number of consumers who were planning to purchase a new car may choose to wait and instead purchase new tires for the car they currently own. Under these circumstances, we would expect U.S. Rubbers stock price to be higher if there is a recession than if the economy is just below average. Merrill Finchs economic forecasting staff has developed probability estimates for the state of the economy, and its security analysts developed a sophisticated computer program to estimate the rate of return on each alternative under each state of the economy. High Tech Inc. is an electronics firm; Collections Inc. collects past-due debts; and U.S. Rubber manufactures tires and various other rubber and plastics products. Merrill Finch also maintains a market portfolio that owns a market-weighted fraction of all publicly traded stocks; you can invest in that portfolio and thus obtain average stock market results. Given the situation described, answer the following question:
You should recognize that basing a decision solely on expected returns is appropriate only for risk-neutral individuals. Because your client, like most people, is risk-averse, the riskiness of each alternative is an important aspect of the decision. One possible measure of risk is the standard deviation of returns:
Draw a graph that shows roughly the shape of the probability distributions for High Tech, U.S. Rubber, and T-bills.
High Eoomayrolbabiry 5. Market 2-Stock Portfolio Portfolio 0.0% ProbabilityT-BilTechCollestions Recession Below average Average Above average Boom 5.5% 5.5 5.5 5.5 5.5 (27096) | | 0.1 0.2 0.4 0.2 0.1 6,0% (7.0) 15.0 30.0 45.0 4.0) (30) 7.5 41.0 120 38.0 10.5 26.0 9.8% 0.0 188 | 3.4 i4 05 1.9 0.88 dv 13.2Step by Step Solution
There are 3 Steps involved in it
Step: 1

Get Instant Access to Expert-Tailored Solutions
See step-by-step solutions with expert insights and AI powered tools for academic success
Step: 2

Step: 3

Ace Your Homework with AI
Get the answers you need in no time with our AI-driven, step-by-step assistance
Get Started


