Answered step by step
Verified Expert Solution
Question
1 Approved Answer
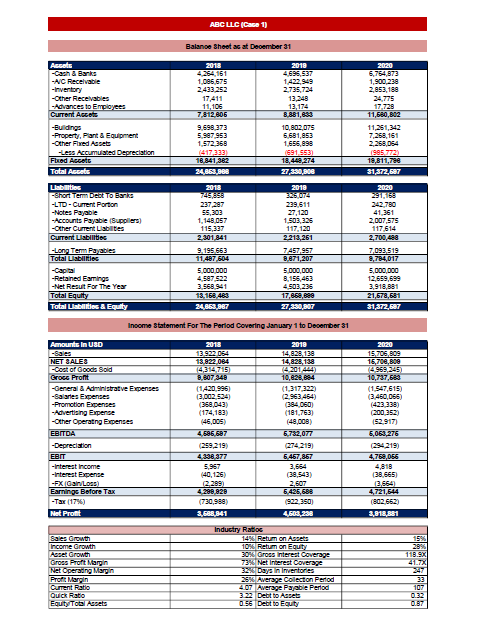
Assume the company will use a retention ratio of 40% in 2020 and the company has 10,000 shares outstanding : a. Calculate the DPS ratio;

Assume the company will use a retention ratio of 40% in 2020 and the company has 10,000 shares outstanding : a. Calculate the DPS ratio; b. Calculate the EPS ratio; c. In your opinion, what will be the impact on the balance sheet and the cash flows in 2020 and later on in 2021?
ABC UC (Case 1) Balance Sheet ac at December 31 Assets Erk: -A/C Receivable -Inventory Other Receivables -Advances to Employees Current Acce -Buldings -Property. Plant & Equipment -Other Fixed Assets -Less Accumulated Depreciation Fixed Accett Total Assets 2013 4.254 151 1.085 675 2.433.252 17,411 11.106 7,812.806 9.698.373 5.987953 1,572.358 (4172321 18.841 382 24,863,888 2018 4696,537 142949 2,735,724 13,248 13.174 8.881,633 10,802.075 6.681,853 1.656,899 (691.553 18,448 274 27,330,808 2020 6,754,873 1,900, 238 2,853,188 24.775 17.729 11,660,002 11,251,342 7,258,161 2.258,054 1995.7721 18,811,78e 31,372,887 2010 20020 Labutis - Short Term Debt To Barks -LTD - Current Porton -Notes Payable -Accounts Payable Suppliers -Other Current Liabilities Current Lang -Long Term Payables Total Liabilities 2013 745,856 237287 55.300 1,148 057 115,337 2.301,841 9,195 653 11.407604 5.000000 4.587.522 3.558.941 13,168,483 24,863,967 229.611 27.120 1.503,325 117,120 2213.261 7,457,957 8871,207 5.000.000 8.156,463 4503,236 17,868,888 27,330,807 242,780 41,361 2,007,575 117.614 2.700,488 7,093,519 9,784,017 5,000,000 12,659,699 3,918,851 21,678,681 31,372,627 -Retained Earnings -Net Result For The Year Total Equity Total Labs & Equity Income Statement For The Period Covering January 1 to December 31 Amounts In USD -Sales NET SALES -Cost of Good Sold Gross Pront -General Administrative Expenses - Salaries Expenses - Promotion Expenses -Advertising Expense -Other Operatng Expenses EBITDA -Depreciation ERIT -Interest Income -Interest Expense -FX in Los Earnings Before Tax -Tax (17%) Net Profit 2018 13.922 054 13.922.064 143147151 8.807 348 (1420.995 (3.002.534 (358,043) (174,183) 146,005 4.586 687 (259,219) 4.338 377 5,957 40,125) 12.299) 4288.828 (730.988) 3,588,841 2018 14,828,139 14,828,138 14 201 444) 10,026,604 (1.317 322) (2.963454) (384060) (181,763) (48,008) 6,732,077 274 2191 6.457,857 3,554 (38,543) 2.507 5.425,686 (922 350) 2020 15.700809 15,708,800 10,737,688 (1.547,615) (3.450,055) (423.238) (200 352) 152.917) 6,061,276 (294219) 4,760,056 4,818 (38.665) (3,554) 4,721,544 (802 662) 3,818.881 4,609,233 15% 113. EX Sales Growth Income Growth Asset Growth Gross Proft Margin Net Operading Margin Prof Margin Current Ratio Quick Rato Equity Total Assets Industry Ratio 1496 Retum on AS 10% Retum on Equity 30% Gross interest Coverage 73% Net Interest Coverage 32 Daya In Invertories 25% Average colecton Period 4.07 Average Payable Period 3.22 Debt to Asset 0.56 Debt to Equity 107 0.87 ABC UC (Case 1) Balance Sheet ac at December 31 Assets Erk: -A/C Receivable -Inventory Other Receivables -Advances to Employees Current Acce -Buldings -Property. Plant & Equipment -Other Fixed Assets -Less Accumulated Depreciation Fixed Accett Total Assets 2013 4.254 151 1.085 675 2.433.252 17,411 11.106 7,812.806 9.698.373 5.987953 1,572.358 (4172321 18.841 382 24,863,888 2018 4696,537 142949 2,735,724 13,248 13.174 8.881,633 10,802.075 6.681,853 1.656,899 (691.553 18,448 274 27,330,808 2020 6,754,873 1,900, 238 2,853,188 24.775 17.729 11,660,002 11,251,342 7,258,161 2.258,054 1995.7721 18,811,78e 31,372,887 2010 20020 Labutis - Short Term Debt To Barks -LTD - Current Porton -Notes Payable -Accounts Payable Suppliers -Other Current Liabilities Current Lang -Long Term Payables Total Liabilities 2013 745,856 237287 55.300 1,148 057 115,337 2.301,841 9,195 653 11.407604 5.000000 4.587.522 3.558.941 13,168,483 24,863,967 229.611 27.120 1.503,325 117,120 2213.261 7,457,957 8871,207 5.000.000 8.156,463 4503,236 17,868,888 27,330,807 242,780 41,361 2,007,575 117.614 2.700,488 7,093,519 9,784,017 5,000,000 12,659,699 3,918,851 21,678,681 31,372,627 -Retained Earnings -Net Result For The Year Total Equity Total Labs & Equity Income Statement For The Period Covering January 1 to December 31 Amounts In USD -Sales NET SALES -Cost of Good Sold Gross Pront -General Administrative Expenses - Salaries Expenses - Promotion Expenses -Advertising Expense -Other Operatng Expenses EBITDA -Depreciation ERIT -Interest Income -Interest Expense -FX in Los Earnings Before Tax -Tax (17%) Net Profit 2018 13.922 054 13.922.064 143147151 8.807 348 (1420.995 (3.002.534 (358,043) (174,183) 146,005 4.586 687 (259,219) 4.338 377 5,957 40,125) 12.299) 4288.828 (730.988) 3,588,841 2018 14,828,139 14,828,138 14 201 444) 10,026,604 (1.317 322) (2.963454) (384060) (181,763) (48,008) 6,732,077 274 2191 6.457,857 3,554 (38,543) 2.507 5.425,686 (922 350) 2020 15.700809 15,708,800 10,737,688 (1.547,615) (3.450,055) (423.238) (200 352) 152.917) 6,061,276 (294219) 4,760,056 4,818 (38.665) (3,554) 4,721,544 (802 662) 3,818.881 4,609,233 15% 113. EX Sales Growth Income Growth Asset Growth Gross Proft Margin Net Operading Margin Prof Margin Current Ratio Quick Rato Equity Total Assets Industry Ratio 1496 Retum on AS 10% Retum on Equity 30% Gross interest Coverage 73% Net Interest Coverage 32 Daya In Invertories 25% Average colecton Period 4.07 Average Payable Period 3.22 Debt to Asset 0.56 Debt to Equity 107 0.87Step by Step Solution
There are 3 Steps involved in it
Step: 1

Get Instant Access to Expert-Tailored Solutions
See step-by-step solutions with expert insights and AI powered tools for academic success
Step: 2

Step: 3

Ace Your Homework with AI
Get the answers you need in no time with our AI-driven, step-by-step assistance
Get Started


