Assume the Market Capitalization of the firm is $1.8 Billion Dollars. Use the Size Decile-Based Risk Premium information provided in the following table (page after regression results) to estimate the cost of equity using our two factor model.


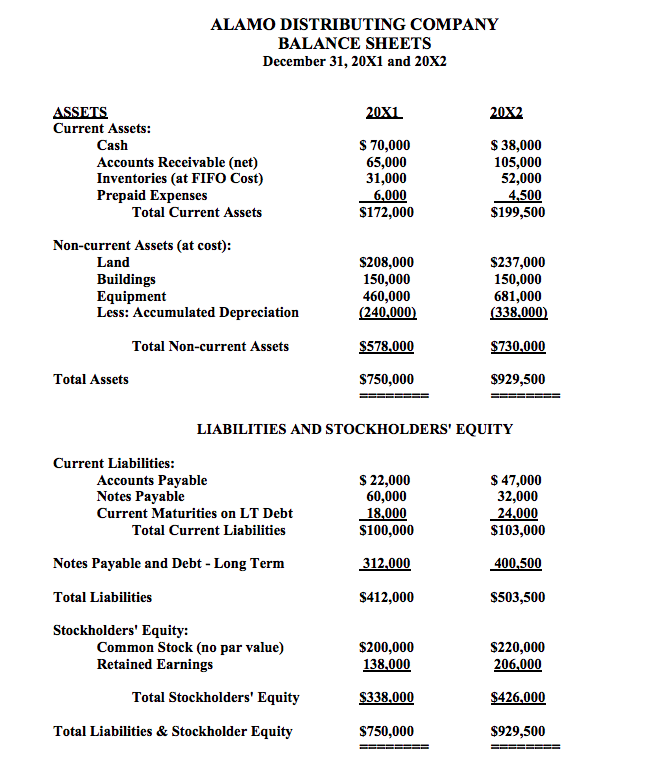
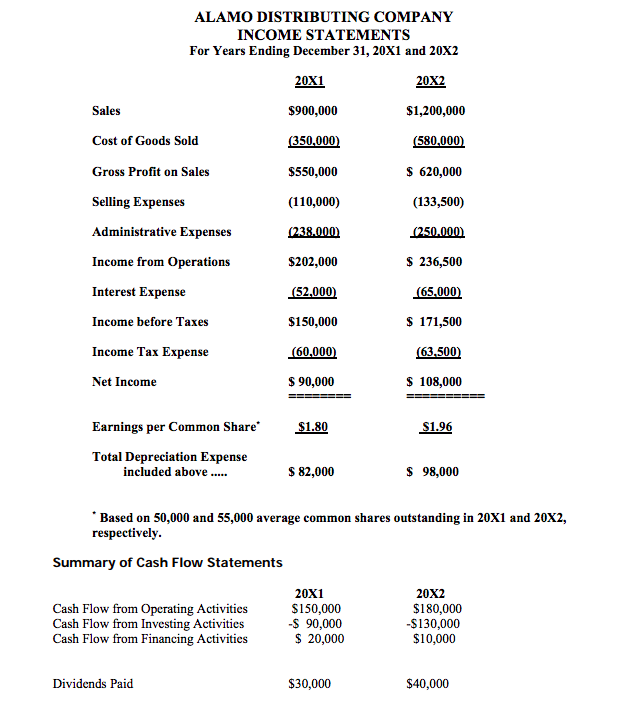
ALAMO DISTRIBUTING COMPANY BALANCE SHEETS December 31, 20X1 and 20X2 20X1 20X2 ASSETS Current Assets: Cash Accounts Receivable (net) Inventories (at FIFO Cost) Prepaid Expenses Total Current Assets $ 70,000 65,000 31,000 6,000 $172,000 $ 38,000 105,000 52,000 4,500 $199,500 Non-current Assets (at cost): Land Buildings Equipment Less: Accumulated Depreciation $208,000 150,000 460,000 (240.000) $237,000 150,000 681,000 (338,000) Total Non-current Assets $578,000 $730,000 Total Assets $750,000 $929,500 LIABILITIES AND STOCKHOLDERS' EQUITY Current Liabilities: Accounts Payable Notes Payable Current Maturities on LT Debt Total Current Liabilities $ 22,000 60,000 18,000 $100,000 $ 47,000 32,000 24,000 $103,000 312,000 400,500 Notes Payable and Debt - Long Term Total Liabilities $412,000 $503,500 Stockholders' Equity: Common Stock (no par value) Retained Earnings Total Stockholders' Equity $200,000 138,000 $220,000 206,000 $338.000 $426,000 Total Liabilities & Stockholder Equity $750,000 $929,500 ALAMO DISTRIBUTING COMPANY INCOME STATEMENTS For Years Ending December 31, 20X1 and 20X2 20X1 20X2 Sales $900,000 $1,200,000 (350,000) (580,000) Cost of Goods Sold Gross Profit on Sales Selling Expenses $550,000 $ 620,000 (110,000) (133,500) Administrative Expenses (238.000) (250.000) Income from Operations $202,000 $ 236,500 Interest Expense (52,000) (65,000) Income before Taxes $150,000 $ 171,500 Income Tax Expense (60,000) (63,500) Net Income $ 90,000 $ 108,000 $1.80 S1.96 Earnings per Common Share Total Depreciation Expense included above..... $ 82,000 $ 98,000 * Based on 50,000 and 55,000 average common shares outstanding in 20X1 and 20x2, respectively. Summary of Cash Flow Statements Cash Flow from Operating Activities Cash Flow from Investing Activities Cash Flow from Financing Activities 20X1 $150,000 -$ 90,000 $ 20,000 20X2 $180,000 -$130,000 $10,000 Dividends Paid $30,000 $40,000 ALAMO DISTRIBUTING COMPANY BALANCE SHEETS December 31, 20X1 and 20X2 20X1 20X2 ASSETS Current Assets: Cash Accounts Receivable (net) Inventories (at FIFO Cost) Prepaid Expenses Total Current Assets $ 70,000 65,000 31,000 6,000 $172,000 $ 38,000 105,000 52,000 4,500 $199,500 Non-current Assets (at cost): Land Buildings Equipment Less: Accumulated Depreciation $208,000 150,000 460,000 (240.000) $237,000 150,000 681,000 (338,000) Total Non-current Assets $578,000 $730,000 Total Assets $750,000 $929,500 LIABILITIES AND STOCKHOLDERS' EQUITY Current Liabilities: Accounts Payable Notes Payable Current Maturities on LT Debt Total Current Liabilities $ 22,000 60,000 18,000 $100,000 $ 47,000 32,000 24,000 $103,000 312,000 400,500 Notes Payable and Debt - Long Term Total Liabilities $412,000 $503,500 Stockholders' Equity: Common Stock (no par value) Retained Earnings Total Stockholders' Equity $200,000 138,000 $220,000 206,000 $338.000 $426,000 Total Liabilities & Stockholder Equity $750,000 $929,500 ALAMO DISTRIBUTING COMPANY INCOME STATEMENTS For Years Ending December 31, 20X1 and 20X2 20X1 20X2 Sales $900,000 $1,200,000 (350,000) (580,000) Cost of Goods Sold Gross Profit on Sales Selling Expenses $550,000 $ 620,000 (110,000) (133,500) Administrative Expenses (238.000) (250.000) Income from Operations $202,000 $ 236,500 Interest Expense (52,000) (65,000) Income before Taxes $150,000 $ 171,500 Income Tax Expense (60,000) (63,500) Net Income $ 90,000 $ 108,000 $1.80 S1.96 Earnings per Common Share Total Depreciation Expense included above..... $ 82,000 $ 98,000 * Based on 50,000 and 55,000 average common shares outstanding in 20X1 and 20x2, respectively. Summary of Cash Flow Statements Cash Flow from Operating Activities Cash Flow from Investing Activities Cash Flow from Financing Activities 20X1 $150,000 -$ 90,000 $ 20,000 20X2 $180,000 -$130,000 $10,000 Dividends Paid $30,000 $40,000


