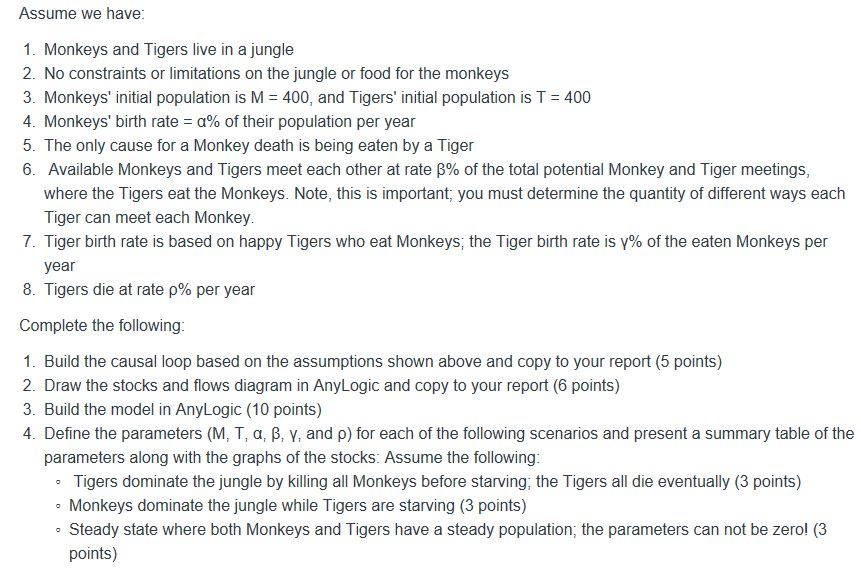
Assume we have 1. Monkeys and Tigers live in a jungle 2. No constraints or limitations on the jungle or food for the monkeys 3. Monkeys' initial population is M 400, and Tigers' initial population is T 400 4. Monkeys' birth rate-a% of their population per year 5. The only cause for a Monkey death is being eaten by a Tiger 6. Available Monkeys and Tigers meet each other at rate 8% of the total potential Monkey and Tiger meetings, Tiger can meet each Monkey. 7. Tiger birth rate is based on happy Tigers who eat Monkeys, the Tiger birth rate is V% of the eaten Monkeys per year 8, Tigers die at rate % per year Complete the following 1. Build the causal loop based on the assumptions shown above and copy to your report (5 points) 2. Draw the stocks and flows diagram in AnyLogic and copy to your report (6 points) 3. Build the model in AnyLogic (10 points) 4. Define the parameters (M. TM, , , and ) for each of the following scenarios and present a summary table of the parameters along with the graphs of the stocks: Assume the following: Tigers dominate the jungle by killing all Monkeys before starving, the Tigers all die eventually (3 points) Monkeys dominate the jungle while Tigers are starving (3 points) o Steady state where both Monkeys and Tigers have a steady population, the parameters can not be zerol (3 points) Assume we have 1. Monkeys and Tigers live in a jungle 2. No constraints or limitations on the jungle or food for the monkeys 3. Monkeys' initial population is M 400, and Tigers' initial population is T 400 4. Monkeys' birth rate-a% of their population per year 5. The only cause for a Monkey death is being eaten by a Tiger 6. Available Monkeys and Tigers meet each other at rate 8% of the total potential Monkey and Tiger meetings, Tiger can meet each Monkey. 7. Tiger birth rate is based on happy Tigers who eat Monkeys, the Tiger birth rate is V% of the eaten Monkeys per year 8, Tigers die at rate % per year Complete the following 1. Build the causal loop based on the assumptions shown above and copy to your report (5 points) 2. Draw the stocks and flows diagram in AnyLogic and copy to your report (6 points) 3. Build the model in AnyLogic (10 points) 4. Define the parameters (M. TM, , , and ) for each of the following scenarios and present a summary table of the parameters along with the graphs of the stocks: Assume the following: Tigers dominate the jungle by killing all Monkeys before starving, the Tigers all die eventually (3 points) Monkeys dominate the jungle while Tigers are starving (3 points) o Steady state where both Monkeys and Tigers have a steady population, the parameters can not be zerol (3 points)


