Assume we replicate an experiment by collecting new observations from the same population and calculate a sample statistic such as the sample mean. We preserve all aspects of the original experiment in our replication (sample size, sampling scheme, target parameter and target population, et cetera), except the actual observations/data collected. Assume that we do not know the population variance/standard deviation and must estimate it from our sample.
a) The sample statistic (the point estimate for the target parameter) calculated for the two experiments (the original and the replication) will be numerically identical: (TRUE OR FALSE)
b) The critical value (in your notes as "Z" or "tn-1", i.e. the Z-scaled or t-scaled critical value) for the two experiments will be (DIFFERENT/IDENTICAL) because (THE EXPERIMENT SETUP IS THE SAME/THE CRITICAL VALUE NEVER CHANGES/THE CRITICAL VALUE IS DETERMINED BY THE UNIQUE SET OF VALUES IN OUR SAMPLE)
c)The margin of error for the two experiments will have (IDENTICAL/DIFFERENT) numerical values because (IT DEPENDS ON THE EXPERIMENTAL PRODUCE/THE OBSERVATIONS IN OUR SAMPLE WILL BE DIFFERENT THUS LIKELY TO HAVE DIFFERENT SPREAD)
d) The confidence intervals calculated for the two experiments will be numerically identical. (TRUE/FALSE)
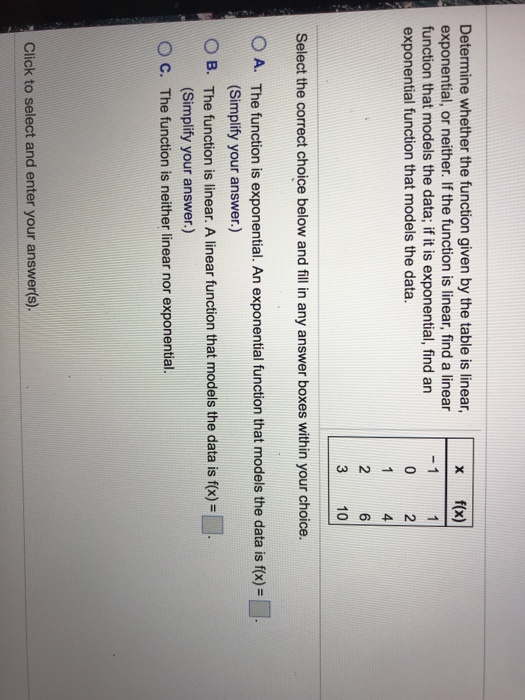
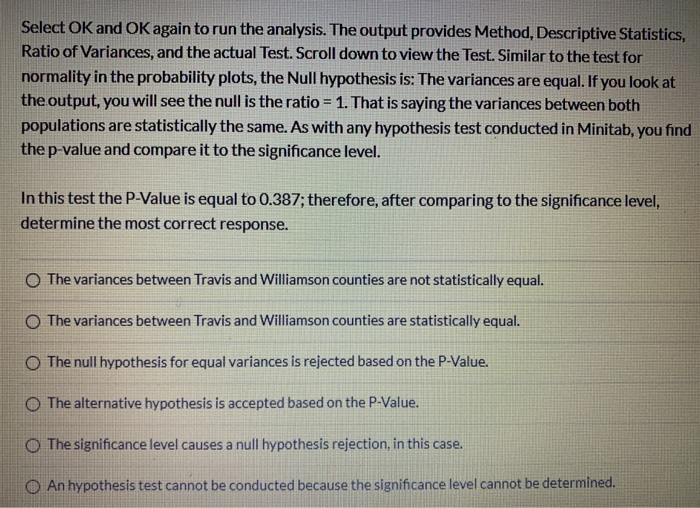
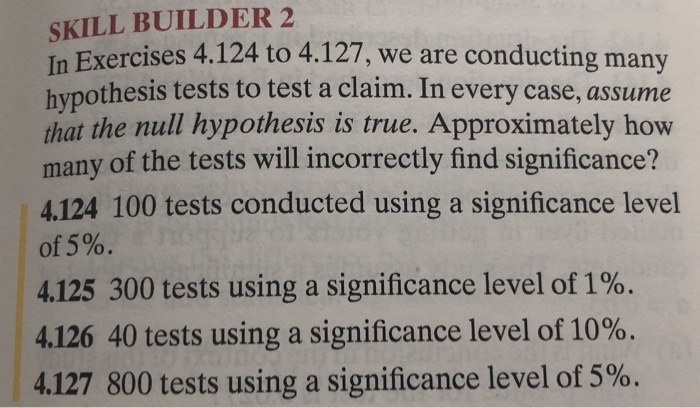
Determine whether the function given by the table is linear, X (X) exponential, or neither. If the function is linear, find a linear function that models the data; if it is exponential, find an exponential function that models the data. FORNO Ntoo Select the correct choice below and fill in any answer boxes within your choice. O A. The function is exponential. An exponential function that models the data is f(x) = (Simplify your answer.) O B. The function is linear. A linear function that models the data is f(x) = (Simplify your answer.) O C. The function is neither linear nor exponential. Click to select and enter your answer(s).13. A one-sided hypothesis test is to be performed with significance level of 0.05. Suppose that the null hypothesis is false. If a significance level of 0.01 were to be used instead of a significance level of 0.05, which of the following would be true? A. Neither the probability of a Type II error nor the power of the test would change. B. Both the probability of a Type II error and the power of the test would decrease. C. Both the probability of a Type II error and the power of the test would increase. D. The probability of a Type II error would decrease and the power of the test would increase. E. The probability of a Type II error would increase and the power of the test would decrease.Select OK and OK again to run the analysis. The output provides Method, Descriptive Statistics, Ratio of Variances, and the actual Test. Scroll down to view the Test. Similar to the test for normality in the probability plots, the Null hypothesis is: The variances are equal. If you look at the output, you will see the null is the ratio = 1. That is saying the variances between both populations are statistically the same. As with any hypothesis test conducted in Minitab, you find the p-value and compare it to the significance level. In this test the P-Value is equal to 0.387; therefore, after comparing to the significance level, determine the most correct response. O The variances between Travis and Williamson counties are not statistically equal. O The variances between Travis and Williamson counties are statistically equal. O The null hypothesis for equal variances is rejected based on the P-Value. O The alternative hypothesis is accepted based on the P-Value. The significance level causes a null hypothesis rejection, in this case. OAn hypothesis test cannot be conducted because the significance level cannot be determined.SKILL BUILDER 2 In Exercises 4.124 to 4.127, we are conducting many hypothesis tests to test a claim. In every case, assume that the null hypothesis is true. Approximately how many of the tests will incorrectly find significance? 4.124 100 tests conducted using a significance level of 5%. 4.125 300 tests using a significance level of 1%. 4.126 40 tests using a significance level of 10%. 4.127 800 tests using a significance level of 5%


