Answered step by step
Verified Expert Solution
Link Copied!

Question

1 Approved Answer

Assume you are considering a portfolio containing two assets, Land M. Asset L will represent 41% of the dollar value of the portfolio, and asset
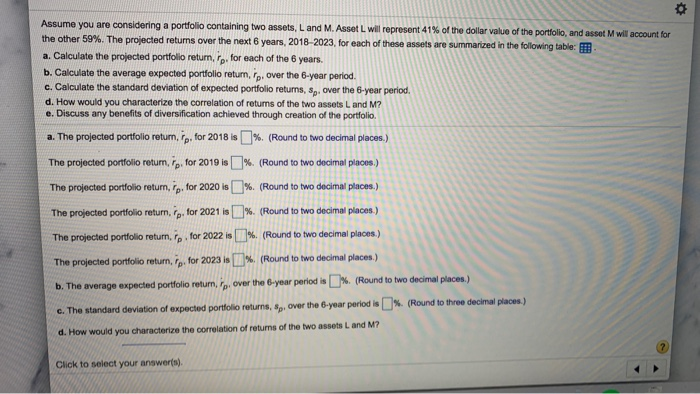
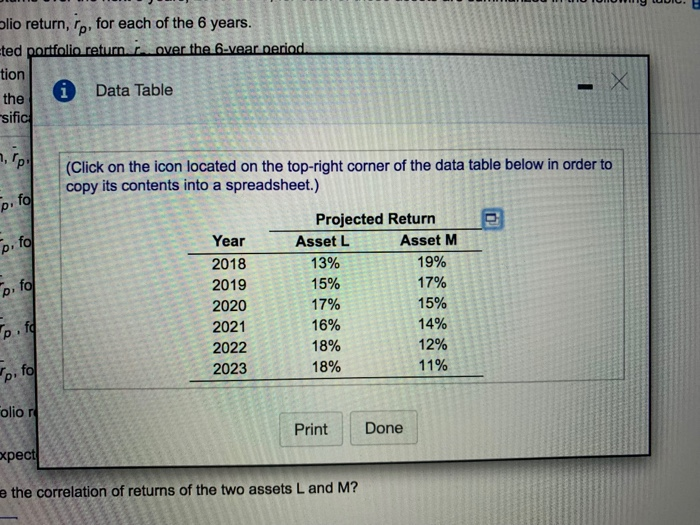
image text in transcribed
Assume you are considering a portfolio containing two assets, Land M. Asset L will represent 41% of the dollar value of the portfolio, and asset M wil account for the other 59%. The projected returns over the next 6 years, 2018-2023, for each of these assets are summarized in the following table: a. Calculate the projected portfolio return, tp, for each of the 6 years. b. Calculate the average expected portfolio return, lp, over the 6-year period. c. Calculate the standard deviation of expected portfolio returns, 8 over the 6-year period. d. How would you characterize the correlation of returns of the two assets L and M? e. Discuss any benefits of diversification achieved through creation of the portfolio a. The projected portfolio return, p, for 2018 is %. (Round to two decimal places.) The projected portfolio return, Tp. for 2019 is %. (Round to two decimal places.) The projected portfolio return, ip. for 2020 is The projected portfolio return, Tp. for 2021 8 The projected portfolio return, Tp. for 2022 is % (Round to two decimal places.) %. (Round to two decimal places) % (Round to two decimal places.) The projected portfolio return, fp, for 2023 is %. (Round to two decimal places.) %. (Round to two decimal places.) b. The average expected portfolio return, to over the 6-year period is %. (Round to three decimal places.) c. The standard deviation of expected portfolio returns, sp, over the 6-year period is d. How would you characterize the correlation of returns of the two assets Land M? Click to select your answer(s). LUUU UUU UUU. blio return, 'p, for each of the 6 years. Eted portfolio return. I.. over the 6-vear period. tion the i Data Table sific 7, rp. (Click on the icon located on the top-right corner of the data table below in order to copy its contents into a spreadsheet.) p.fo pito Year 2018 13% 17% eee pitol 2019 2020 2021 2022 2023 Projected Return Asset L Asset M 19% 15% 17% 15% 16% 14% 18% 12% 18% 11% olio Print Done expect e the correlation of returns of the two assets L and M

Step by Step Solution

There are 3 Steps involved in it

Step: 1

blur-text-image

Get Instant Access to Expert-Tailored Solutions

See step-by-step solutions with expert insights and AI powered tools for academic success

Step: 2

blur-text-image_2

Step: 3

blur-text-image_3

Ace Your Homework with AI

Get the answers you need in no time with our AI-driven, step-by-step assistance

Get Started

Recommended Textbook for

Foundations of Financial Management

Authors: Stanley Block, Geoffrey Hirt, Bartley Danielsen, Doug Short, Michael Perretta

10th Canadian edition

1259261018, 1259261015, 978-1259024979

More Books

Students also viewed these Finance questions

Question

please dont use chat gpt AI 7 6 0 . ( TBL )

Answered: 1 week ago