

Answered step by step
Verified Expert Solution
Question
1 Approved Answer
Assume you are evaluating two stocks, Stock A and Stock B. Stock A has an expected return and standard deviation of 10 percent and 29
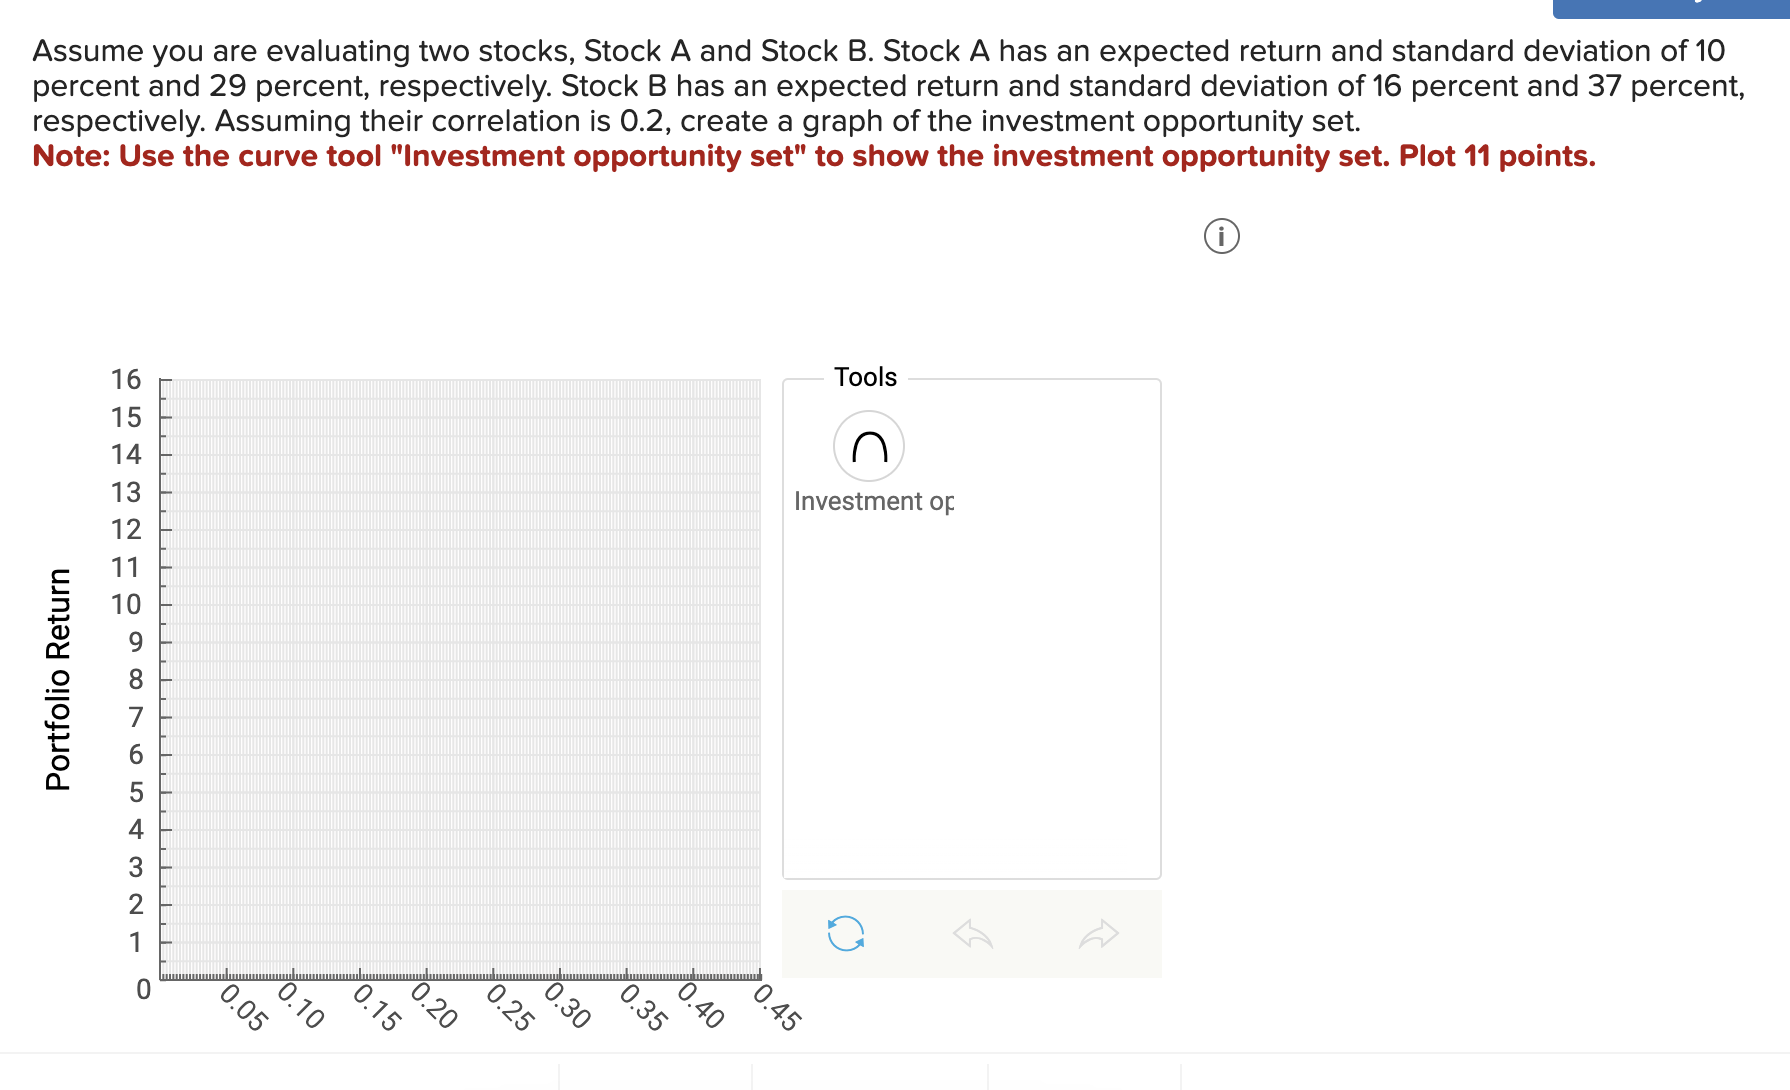 Assume you are evaluating two stocks, Stock A and Stock B. Stock A has an expected return and standard deviation of 10 percent and 29 percent, respectively. Stock B has an expected return and standard deviation of 16 percent and 37 percent, respectively. Assuming their correlation is 0.2 , create a graph of the investment opportunity set. Note: Use the curve tool "Investment opportunity set" to show the investment opportunity set. Plot 11 points
 Step by Step Solution
There are 3 Steps involved in it
Step: 1

Get Instant Access to Expert-Tailored Solutions
See step-by-step solutions with expert insights and AI powered tools for academic success
Step: 2

Step: 3
Ace Your Homework with AI
Get the answers you need in no time with our AI-driven, step-by-step assistance
Get Started
Energy And Finance Sustainability In The Energy Industry
Authors: André Dorsman, Özgür Arslan-Ayaydin, Mehmet Baha Karan
1st Edition
3319322664, 978-3319322667