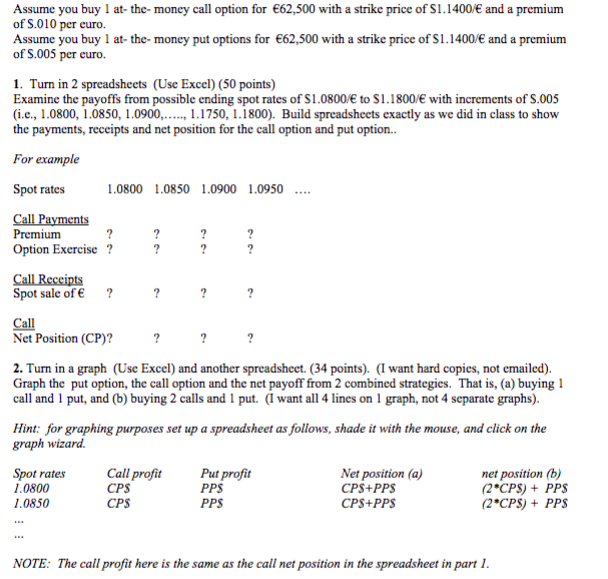
Assume you buy 1 at-the-money call option for 62,500 with a strike price of $1.1400/ and a premium of S.010 per euro. Assume you buy 1 at-the-money put options for 62,500 with a strike price of $1.1400/ and a premium of S.005 per euro. 1. Turn in 2 spreadsheets (Use Excel) (50 points) Examine the payoffs from possible ending spot rates of $1.0800/ to $1.1800/ with increments of 5.005 (i.e., 1.0800, 1.0850, 1.0900....... 1.1750, 1.1800). Build spreadsheets exactly as we did in class to show the payments, receipts and net position for the call option and put option.. For example Spot rates 1.0800 1.0850 1.0900 1.0950 .... Call Payments Premium ? Option Exercise ? Call Receipts Spot sale of ? Call Net Position (CP)? 2. Turn in a graph (Use Excel) and another spreadsheet. (34 points). (I want hard copies, not emailed). Graph the put option, the call option and the net payoff from 2 combined strategies. That is, (a) buying 1 call and 1 put, and (b) buying 2 calls and I put. (I want all 4 lines on 1 graph, not 4 separate graphs). Hint: for graphing purposes set up a spreadsheet as follows, shade it with the mouse, and click on the graph wizard Spot rates Call profit Put profit Net position (a) net position (b) 1.0800 CPS PPS CPS+PPS (2*CPS) + PPS 1.0850 PPS CPS+PPS (2*CPS) + PPS CPS NOTE: The call profit here is the same as the call net position in the spreadsheet in part 1. Assume you buy 1 at-the-money call option for 62,500 with a strike price of $1.1400/ and a premium of S.010 per euro. Assume you buy 1 at-the-money put options for 62,500 with a strike price of $1.1400/ and a premium of S.005 per euro. 1. Turn in 2 spreadsheets (Use Excel) (50 points) Examine the payoffs from possible ending spot rates of $1.0800/ to $1.1800/ with increments of 5.005 (i.e., 1.0800, 1.0850, 1.0900....... 1.1750, 1.1800). Build spreadsheets exactly as we did in class to show the payments, receipts and net position for the call option and put option.. For example Spot rates 1.0800 1.0850 1.0900 1.0950 .... Call Payments Premium ? Option Exercise ? Call Receipts Spot sale of ? Call Net Position (CP)? 2. Turn in a graph (Use Excel) and another spreadsheet. (34 points). (I want hard copies, not emailed). Graph the put option, the call option and the net payoff from 2 combined strategies. That is, (a) buying 1 call and 1 put, and (b) buying 2 calls and I put. (I want all 4 lines on 1 graph, not 4 separate graphs). Hint: for graphing purposes set up a spreadsheet as follows, shade it with the mouse, and click on the graph wizard Spot rates Call profit Put profit Net position (a) net position (b) 1.0800 CPS PPS CPS+PPS (2*CPS) + PPS 1.0850 PPS CPS+PPS (2*CPS) + PPS CPS NOTE: The call profit here is the same as the call net position in the spreadsheet in


