

Question
Assumptions: Risk Free Rate 3% Market Return 8% ERP = Market return Rf = 5% Perpetuity Growth Rates Dividend Growth Rate 3% FCFF Growth Rate
- Assumptions:
-
Risk Free Rate 3%
-
Market Return 8%
-
ERP = Market return Rf = 5%
-
Perpetuity Growth Rates
-
Dividend Growth Rate 3%
-
FCFF Growth Rate 3%
-
FCFE Growth Rate 3%
-
Tax rate 20%.
-
-
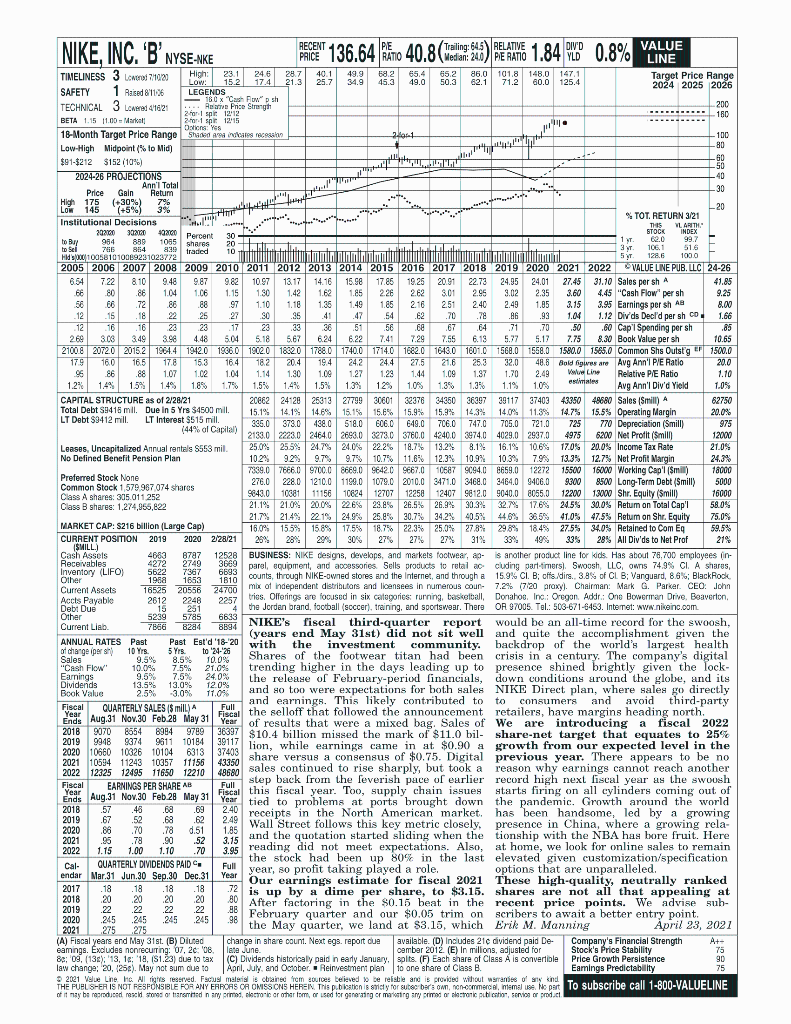
What is the average annual expected growth rate in Sales between 2021 and 2025?
6%
10.4%
9.7%
8.3%
NIKE, INC. 'B' NYSE-NKE PERCENT 136.64 40 40.8 (Wedig 2:8) PLANTE 1.84 OD 0.8% YAKE TO 6 percent INDEX 1 T 02.0 106.1 1000 194 Trailing: 645 RELATIVE DIVD VALUE LINE TIMELINESS 3 Loto 7/1001 High: 231 344 24.6 28.7 40.1 49.9 58.2 65.4 65.2 86.0 101.8 148.0 1471 Low: 15.2 17.4 21.3 25.7 34.9 45.3 Target Price Range 49.0 50.3 62.1 71.2 60.0 125.4 SAFETY 1 Rated 811126 LEGENDS 2024 2025 2026 160 x Cash Flow" sh TECHNICAL 3 Lowted 41621 ...Reatre Price Strength Home 200 2 for spit 12:12 180 BETA 1.15 11.00 - Marel 2.fort Shirt 1215 Dotions: Yes 18-Month Target Price Range Shared A indicates reces 21 100 Low-High Midpoint to Mid) -80 $91-$212 $152 (10%) GO -50 2024-26 PROJECTIONS wy -40 Ann'l Total Price Gain Retum -30 High 175 (-30%) 7% Low 145 (+5%) % 3% 20 TOT. RETURN 3/21 Institutional Decisions S.. Thes VL ARITH. 202001 303100 30 STOCK to Buy 984 889 1085 shares T. 99.7 20+ to Sei 766 854 839 traded Hut 3 516 Hildsc100581010009231023772 5 y 128.6 2005 2006 2007 2008 2009 2010 2011 2012 2013 2014 2015 2016 2017 2018 2019 2020 2021 2022 VALUE LINE PUB. LLC 24-26 . 6.54 7.22 8.10 9.48 9.87 982 1097 13.17 14.16 15.98 17.85 19.25 20.91 22.73 24.95 24.01 27.45 31.10 Sales per sh A 41.85 GE 80 .88 1.04 1.06 1.15 1.50 1.42 1.62 1.85 226 2.62 8.01 2.95 3.02 2.35 3.60 4.45 "Cash Flow' per sh 9.25 .66 .72 .86 .88 97 1.10 1.18 1.35 1.49 1.85 2.16 2.51 2.40 2.49 1.85 3.15 3.95 Earnings per sh AB 8.00 .12 15 .18 22 25 27 SO .35 .41 .47 .54 .62 .70 .78 .86 .93 1.04 1.12 Divds Decl'd per sh Co 1.66 12 16 .16 22 23 17 28 33 38 51 56 68 67 64 71 .70 .50 .60 Cap' Spending per sh .85 269 3.08 3.49 3.98 4.48 5.04 5.18 5.67 6.24 6.22 7.41 7.29 7.55 6.18 5.77 5.17 7.75 8.30 Book Value per sh 10.65 21008 20720 2015.2 1964.4 1942.0 1966.0 1902.0 18:20 1788.0 1740.0 1714.0 1682.0 1643.0 1601.0 1568.0 1558.0 1580.0 1585.0 Common Shs Outstg er 1500.0 179 16.01 16.5 17.8 15.3 16.4 182 204 24.2 244 27.5 21.6 25 32.0 40.5 Bold figwe are Avg Ann' PE Ratio 20.0 96 86 88 1.07 1.02 1.04 1.14 1.30 1.08 1.27 1.28 1.44 1.09 1.87 1.70 2.49 Value Line Relative PE Ratio 1.10 1.2% % 1.4% 1.5% 1.4% 1.8% 1.5% 1.4% estimates 1.5% 1.3% 12% 1.0% 135 13% % 1.1% 1.0% Avg Ann'l Div'd Yield 1.05 CAPITAL STRUCTURE as of 2/28/21 20862 24128 25313 27799 30601 32378 34350 36397 39117 37403 43350 49680 Sales (Smill) A 62750 Total Debt S9415 mil. Due in 5 Yrs $4500 mill. 15.1% 14.1% 14.6% 14.6% 15.15 15.6% 15.9% 15.9% 14.3% 14.0% 11.3% 14.7% 14.7% 15.5% Operating Margin 20.0% LT Debt $9412 mill LT Interest $515 mill. 306.0 373.0 438.0 518.0 606.0 649.0 7C6.0 747.0 705.0 721.0 725 770 Depreciation (Smill) 975 (44% of Capital) 2133.0 2280 24640 2690.0 3273.0 3760.0 4240.0 3474,0 4029.0 29970 4975 6200 Net Profit (Smilo 12000 Leases, Uncapitalized Annual rentals S553 mil. 25.0% 25.5 24.7% 24.0% 22.2% 18.7% 13.2% 8.1% 16.1% 10.69 17.06 20.0% Income Tax Rate 21.05 No Defined Benefit Pension Plan 102% 92% 9.7% 97% 10.7% 11.6% 12.3% 10.9% % 10.3% 7.9% 13.3% % 12.75 Net Profit Margin 24.3% 7339.0 7666.0 970008569.0 96420 9667.0 10687 9094.0 6659.0 12272 15500 Preferred Stock None 16000 Working Cap'l (Smil) 18000 Common Stock 1,570.967 074 shares 276.0 228.0 1210.0 228.0 1210.0 1199.0 1079.0 2010.0 3471.0 3468.C 3464.0 9406.0 9300 8500 Long-Term Debt (Smilly 5000 Class A shares: 305.011 252 9643.0 10001 11156 10824 12707 12258 12407 9812.0 9040.0 8055.0 12200 13000 Shr. Equity (Smill) 16000 Class B shares: 1,274,956,822 21.1% 21.0 20.0 22.6% 28.8% 26.5% 26.9% 30.3% 32. 17.6% 20.56 30.0% Retum on Total Cap'l 58 OS 21.7% 21.4% % 2219 24.9% 25.0% 30.7% 34.2% 40.5% 44.8% 36.5 41.0% 47.53 Retum on Shr. Equity % MARKET CAP: 5216 billion (Large Cap) 75.05 16.0% 155% 158% 17.5 187% 22.3% 25.0% 27.8% 298% 184% 27.5% 34.0% Retained to Com Eq 59.5% CURRENT POSITION 2019 2020 2/28/21 % 23% 28% 20% 30% 27% 27% % 27% 31% 33% 49% 33% 28% All Div'ds to Net Prof 218 SMILL.) Cash Assets 4683 8787 Receivables , 4272 12528 BUSINESS: NIKE designs, develops, and markets footwear, a - is another product line for kids. Has about 78.700 emolayees in 2749 Inventory (LIFO) 3669 parel, equipment, and accessories Sells products to retal ac 5622 7387 6693 cluding part-timers). Swoosh, LLC, owns 74.9% CI A shares Other 1958 1653 1810 counts, through NIKE-owned stores and the Internet, and through a 15.9CI. B; ofis.dirs., 3.8of CL B; Vanguard, 8.6%; BlackRock a . , Current Assets 16525 20556 24700 mix of independent distributors and licensees in numerous cour 7.2% (7120 proxy). Chairman: Mark G. Parker. CEO John Accts Payable 2612 2248 2257 triss. Offerings are focused in six categories: rurning, basketball, Donahos. Inc: Oregon Addr: One Bowerran Drive, Beaverton Debt Duo 15 251 4 the Jordan brand, football (soccer), training, and sportswear. There OR 97005. Tel.: 503-671-6453. Internet: www.nikeinc.com Other 5239 5785 6633 Current Liab. 7866 8284 8894 NIKE's fiscal third-quarter report would be an all-time record for the swoosh, ANNUAL RATES Past Past Est'd '18-20 with (years end May 31st) did not sit well and quite the accomplishment given the the investment of charge pers community, sy 10 Yrs. 5 Yrs. to '24-26 backdrop of the world's largest health Sales 9.5% 8.5% 10.0% Shares of the footwear titan had been crisis in a century. The company's digital "Cash Flow 10.0% 7.5% 21.0% trending higher in the days leading up to presence shined brightly given the lock- Earnings 9.5% 7.6% 24,0% % Dividends the release of February-period financials, down conditions around the globe, and its 13.5% 13.0 % 12.09 Book Value 2.5% 3.0% 11.0% and so too were expectations for both sales NIKE Direct plan, where sales go directly and earnings. This likely contributed to to consumers and avoid third-party . Fiscal QUARTERLY SALES ($ mil) A Full - Aug.31 Nov.30 Feb 28 May 31 let the selloff that followed the announcement retailers, have margins heading north Year 2018 90708554 . 9789 36337 $10.4 billion missed the mark of $11.0 bil-share-net target that equates to 25% 2019 9948 9374 9611 9511 10184 29117 lion, while earnings came in at $0.90 a growth from our expected level in the 2020 10560 10326 10104 6313 37403 2021 10594 11243 10357 11156 43350 share versus a consensus of $0.75. Digital previous year. There appears to be no 2022 12325 12495 11650 12210 48680 sales continued to rise sharply, but took a reason why earnings cannot reach another Fiscal EARNINGS PER SHARE AB Full step back from the everish pace of earlier record high next fiscal year as the swoosh Ende Aug.31 Nov. 30 Feb 28 May 31 Feel this fiscal year. Too, supply chain. issues starts firing on all cylinders coming out of Year Year tied to problems at ports brought down the pandemic. Growth around the world 2018 .57 .45 .68 .69 2.40 receipts in the North American market. has been handsome, led by a growing 2019 .67 .52 .63 .62 2.49 2020 .86 .78 70 0.51 Wall Street follows this key metric closely, presence in China, where a growing rela- 18 2021 .95 .78 .90 .52 3.15 and the quotation started sliding when the tionship with the NBA has bore fruit. Here 2022 1.15 1.00 1.10 .70 3.95 reading did not meet expectations. Also, at home, we look for online sales to remain Cal- QUARTERLY DIVIDENDS PAID the stock had been up 80% in the last elevated given customization/specification Full endar Mar 31 Jun 30 Sep.30 Dec.31 year, so profit taking played a role. Year options that are unparalleled. Our earnings estimate for fiscal 2021 These high-quality, neutrally ranked 2017 .18 .18 18 18 72 2018 is up by a dime per share, to $3.15. shares are not all that appealing at 20 20 20 20 2019 8. After factoring in the $0.15 beat in the recent price points. We advise sub- .22 .2222 .22 2020 .245 .245 8 February quarter and our $0.05 trim on .245 .245 scribers to await a better entry point. .98 2021 275 275 the May quarter, we land at $3.15, which Erik M. Manning April 23, 2021 (A) Fiscal years and May 31st. (B) Diuted changa in share count. Next egs.report de available. (D) Includes 21 dividend paid De Company's Financial Strength At- eamings. Excludes nonrecurring 07, 2008, late June cember 2012. (E) In millions, adjusted for Stock's Price Stability 75 8:08, (138); '13, 16, 18, (S1.23) due to tax (C) Dividends historicaly paid in early January, spits. (F) Each share of Class A is convertible Price Growth Persistence law change: 20,25). May not sum due to Apnl, July and October. Reinvestment plan to one share of Class B. , Eamings Predictability 75 92021 Value Line H. All rights reserved. Focus material is cbained tem source: believed to be reliable and is provided without warranties of and THE FUEL SHER IS NOT RESPONSIBLE FOR ANY ERRORS OR OMISSONS HEREN This bestion is sviety for Buteo burlon, conocer el, memel toe. Wsport To subscribe call 1-800-VALUELINE of it may be reproduced nescid stones or trained in any prime letronic or other form, or used for generating or mariting any rims or latronic publication, serving or prod.cl en Aug.31 Nov,20 Feb 28 May 31 Ver of results that were a mixed bag Sales of We are introducing a fiscal 2022 90Step by Step Solution
There are 3 Steps involved in it
Step: 1

Get Instant Access to Expert-Tailored Solutions
See step-by-step solutions with expert insights and AI powered tools for academic success
Step: 2

Step: 3
Ace Your Homework with AI
Get the answers you need in no time with our AI-driven, step-by-step assistance
Get Started
Own Your Money
Authors: Michela Allocca
1st Edition
0760381127, 978-0760381120