Assumptions:
- Risk Free Rate3%
- Market Return8%
- ERP = Market return - Rf = 5%
- Perpetuity Growth Rates
- Dividend Growth Rate3%
- FCFF Growth Rate3%
- FCFE Growth Rate3%
- Tax rate 20%.
What is the equity value if the market value of debt is $9,406 million?
a) $236,442 million
b) $132,203 million
c) $318,362 million
d) $434,386 million
What is the value of NIKE's shares using the FCFF model if the company has 1,558 million shares outstanding?
a) $64.38
b) $310.32
c) $112.64
d) $151.75
What is the value of NIKE's shares using the Dividend Discount Model if the company has 1,558 million shares outstanding and the long term growth rate in dividends is expected to be 3%?
a) $64.38
b) $110.32
c) $82.64
d) $24.66
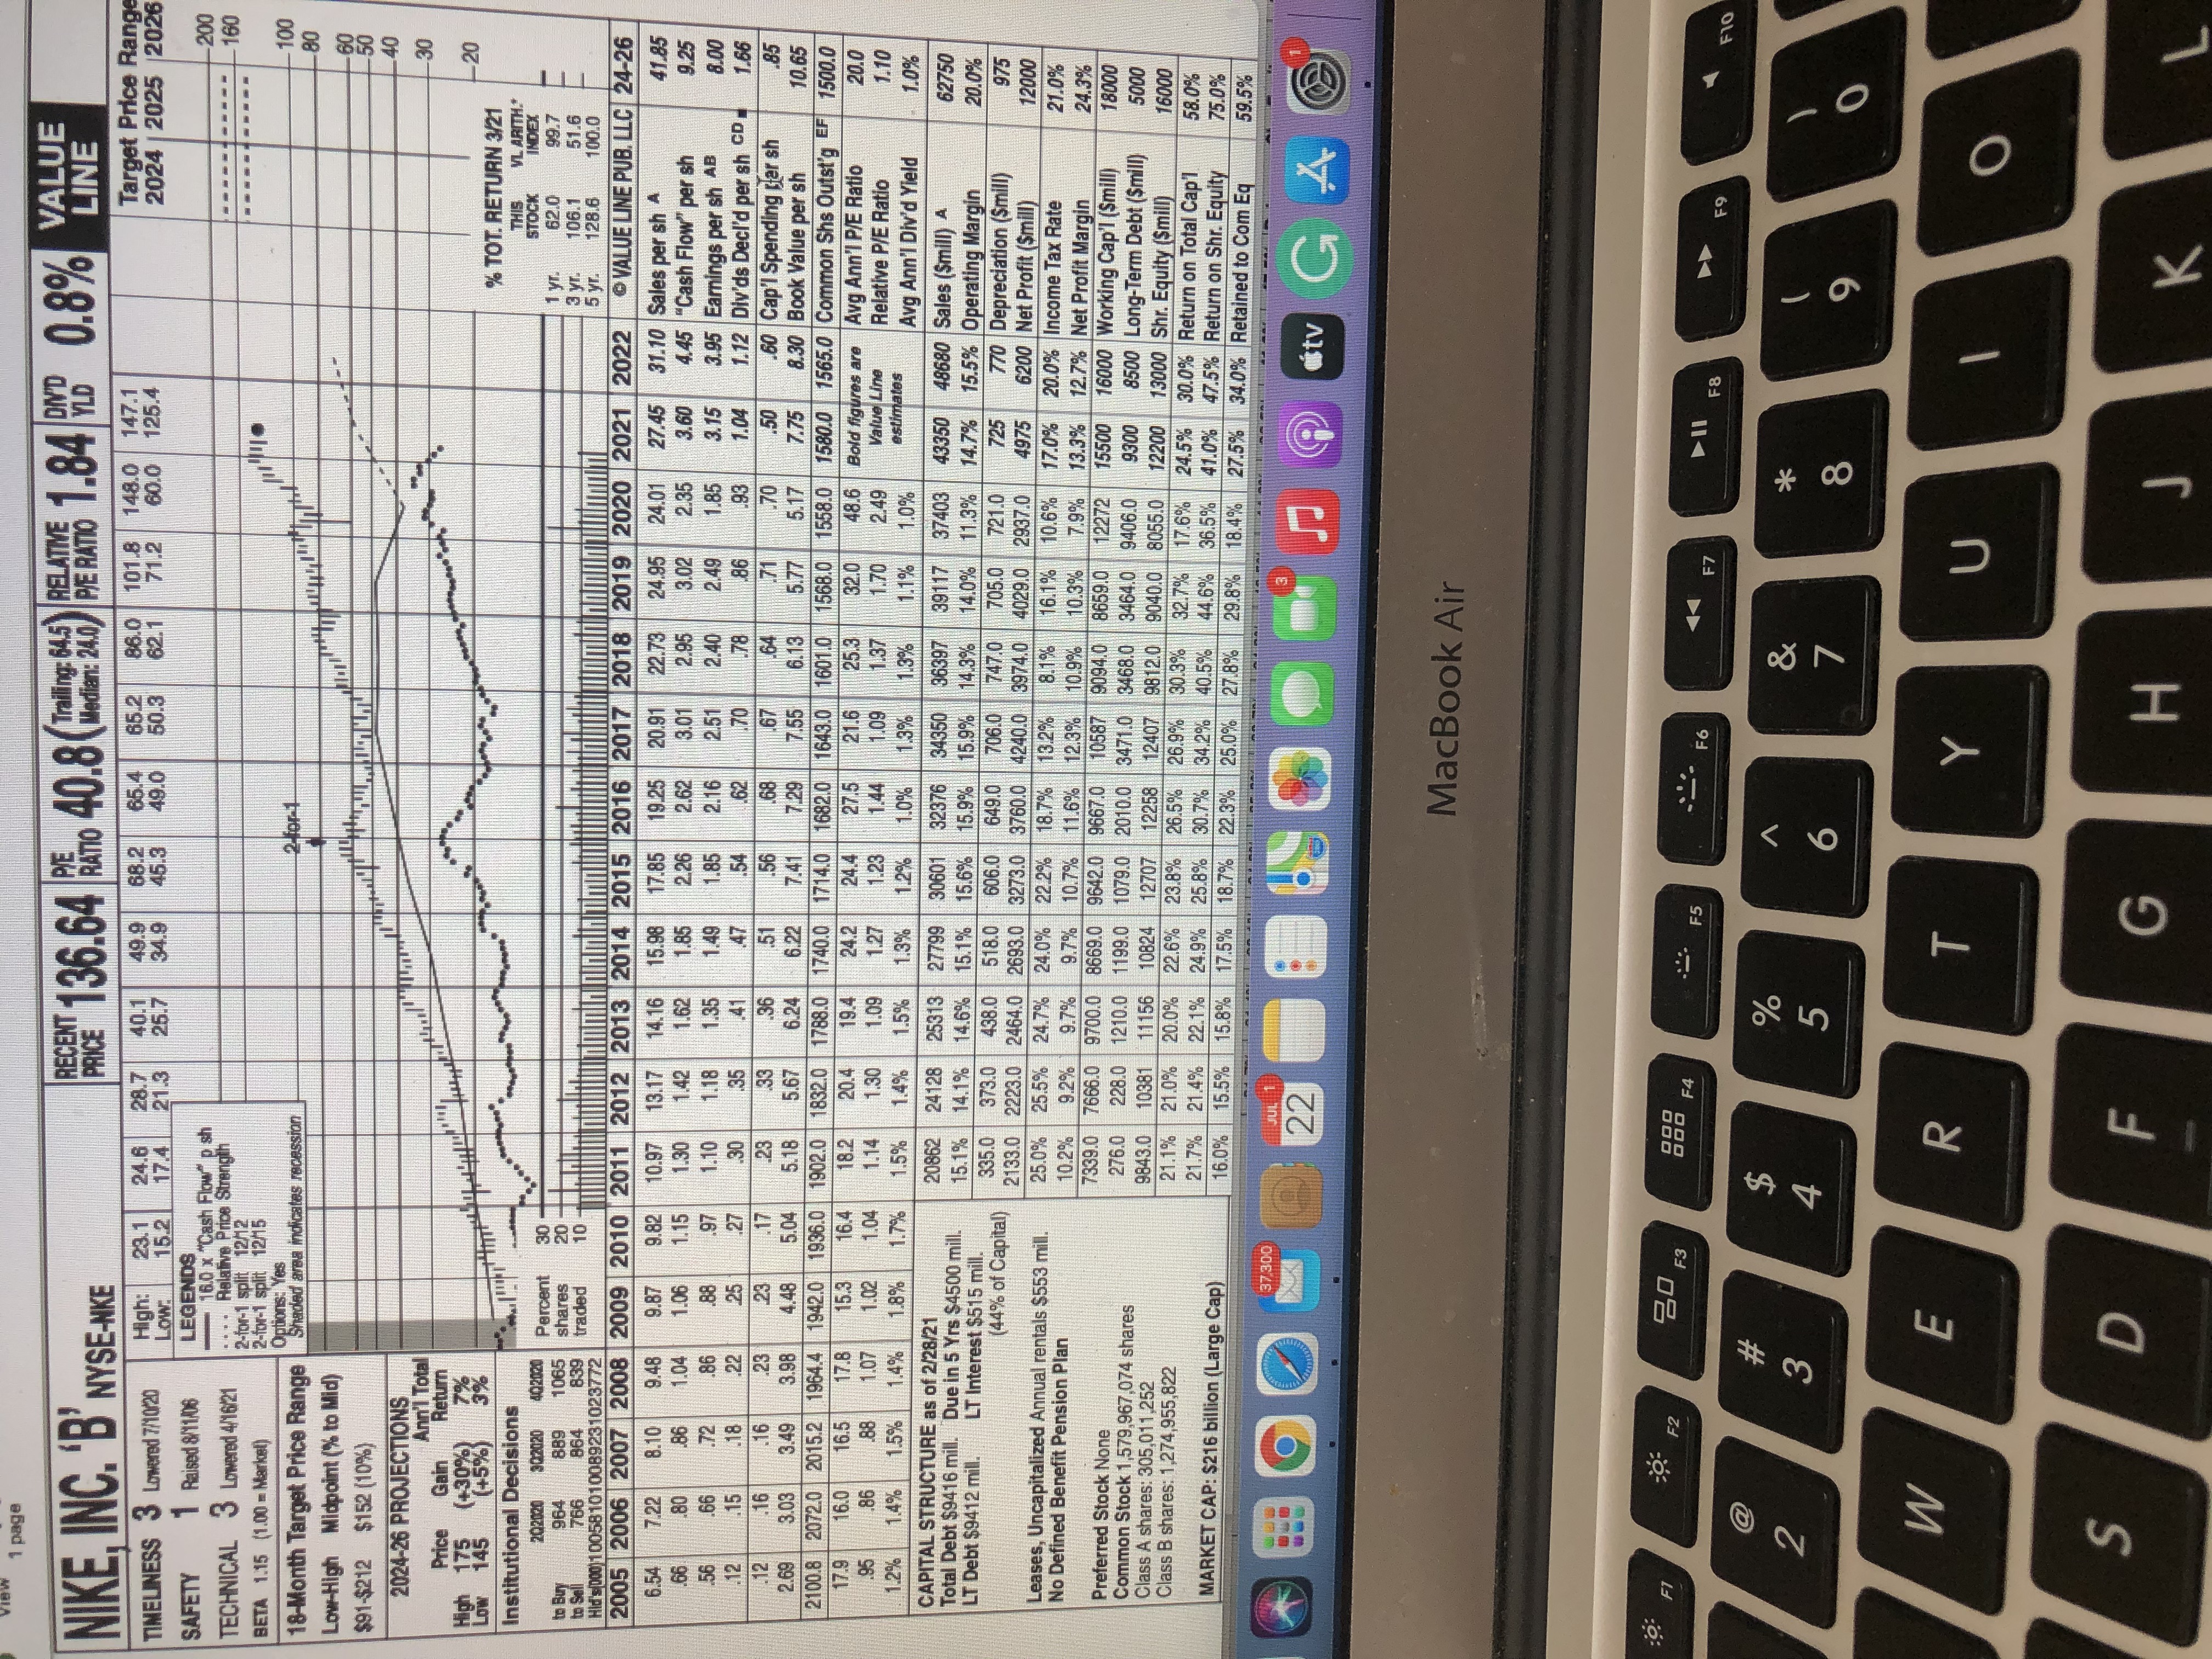
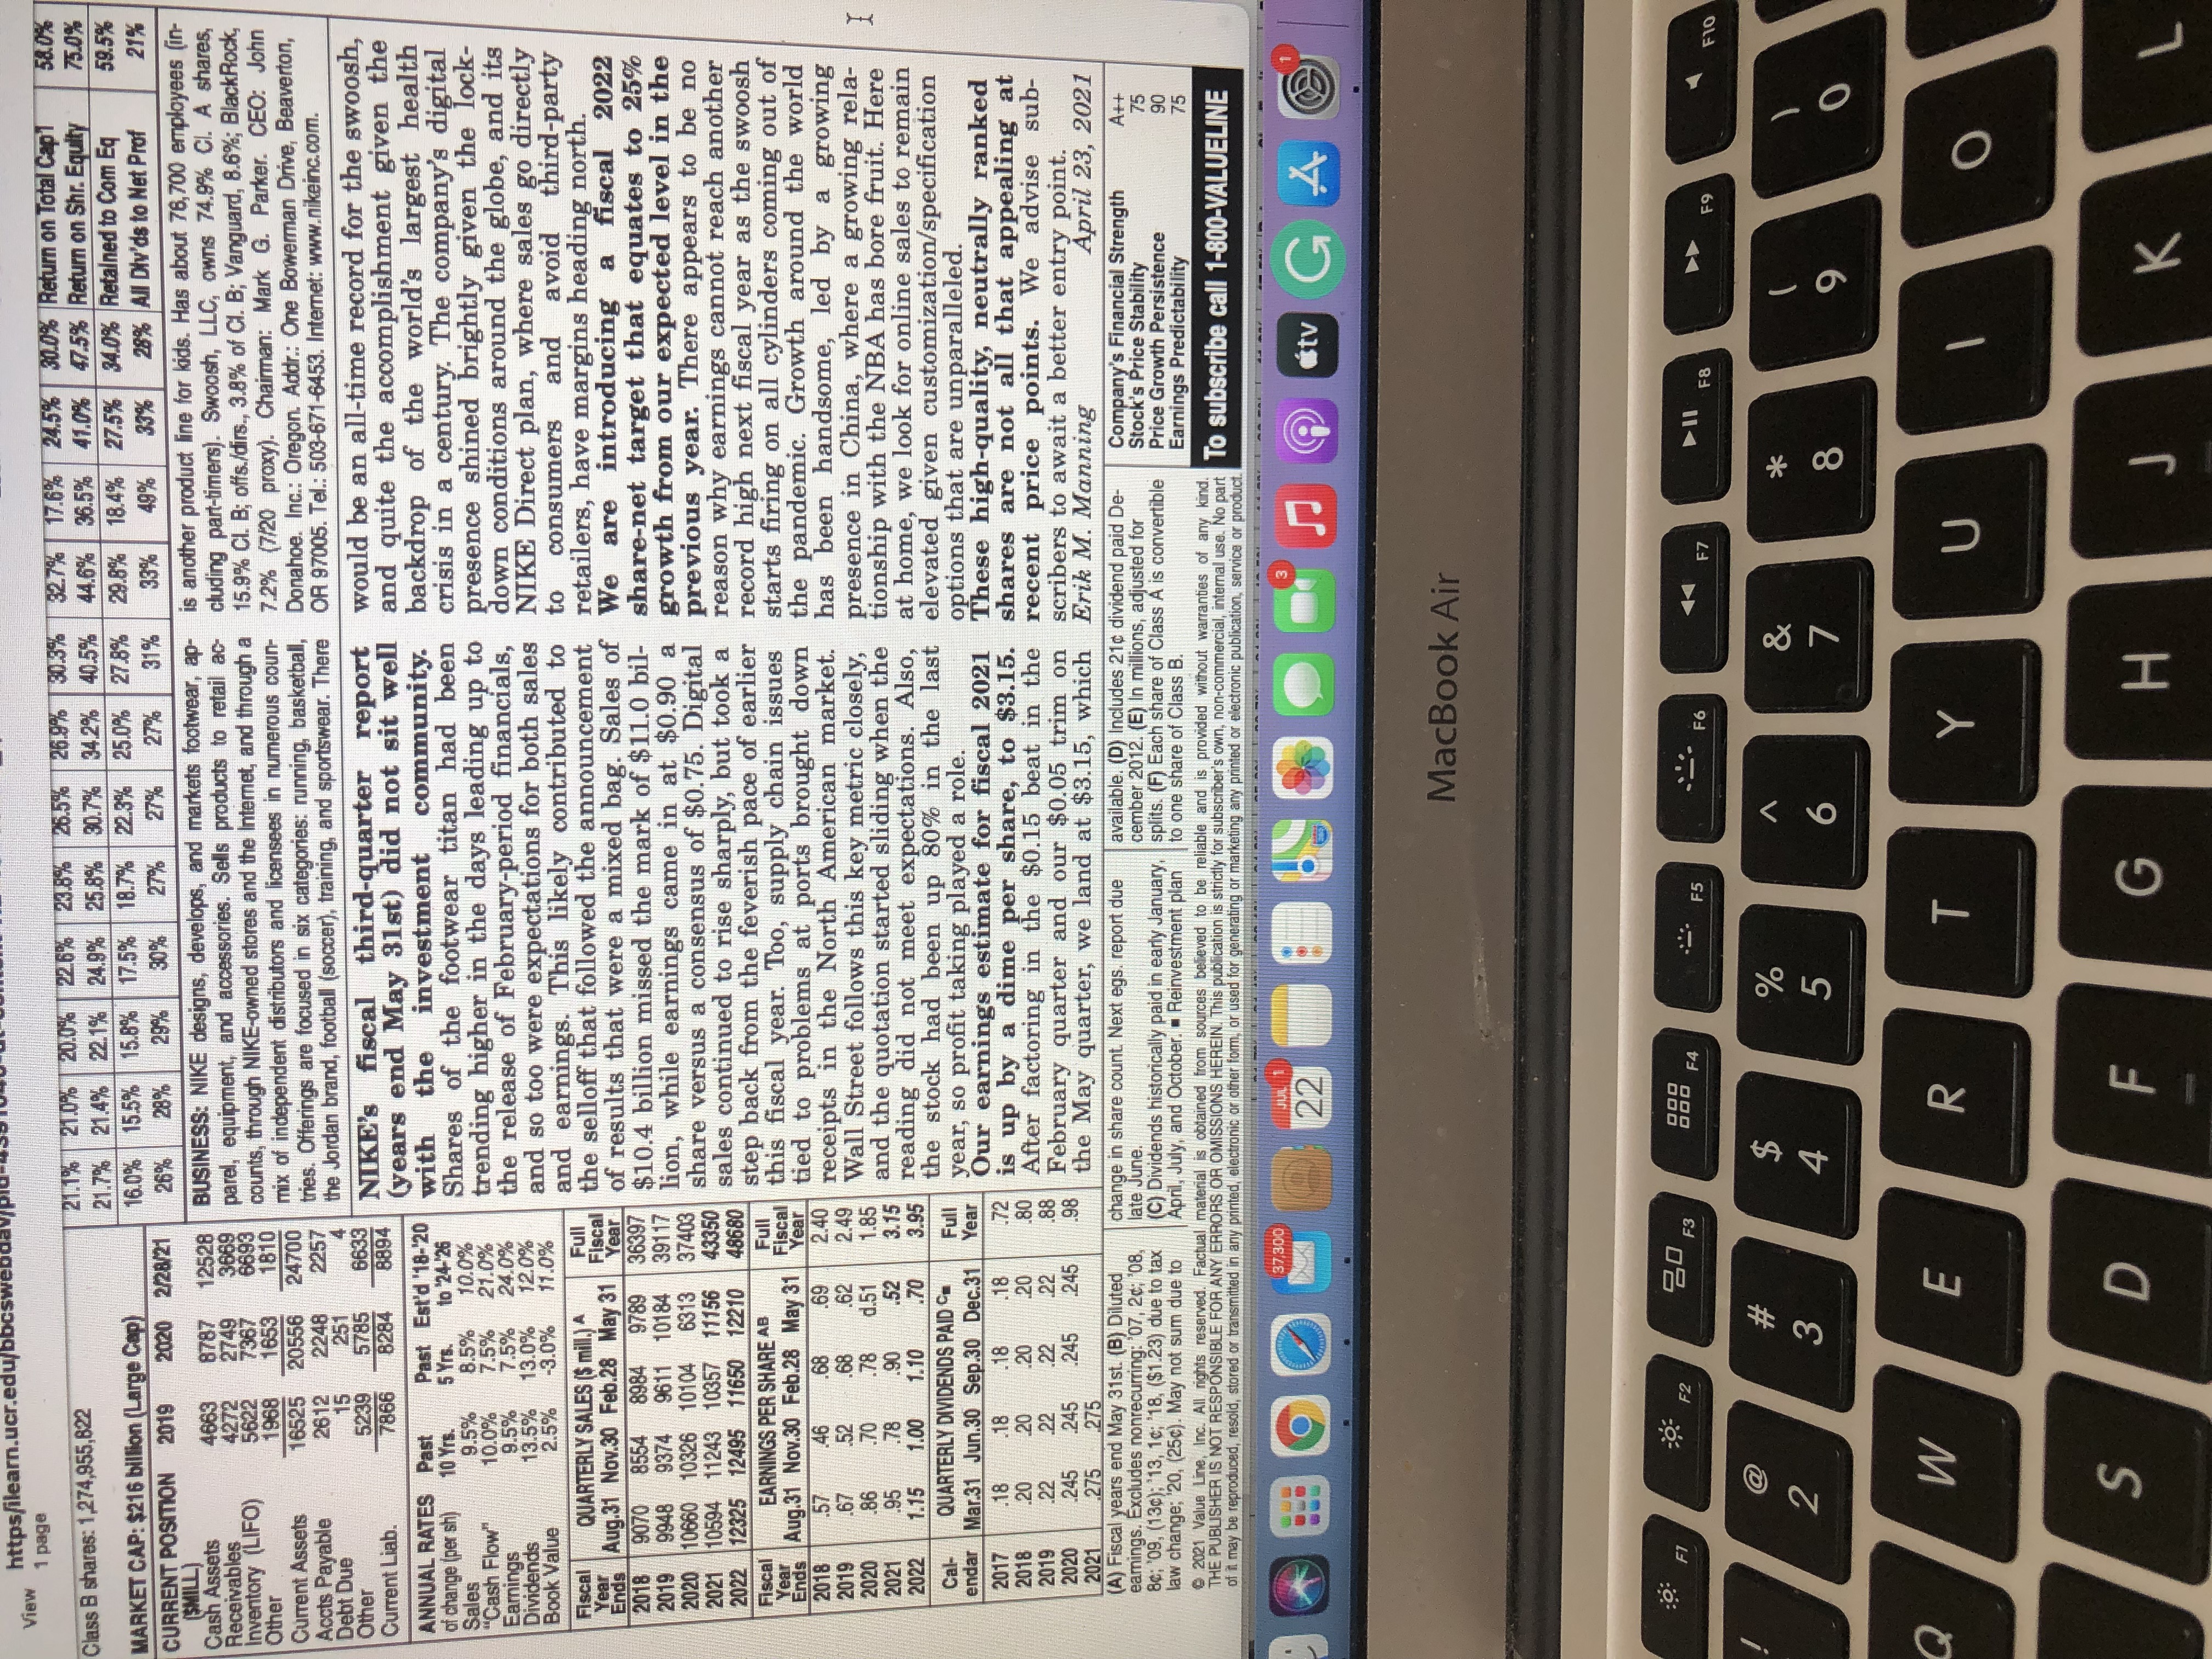
1 page RECENT 136.64 BETO 40.8 Trailing: 64.5\\ RELATIVE 1.84 PND NIKE, INC. 'B' edian: 24.0 P/E RATIO 0.8% VALUE PRICE LINE 148.0 |147.1 Target Price Rang High: 23.1 24.6 28.7 40.1 49.9 68.2 65.4 85.2 86.0 101.8 62.1 71.2 60.0 125.4 2024 | 2025 202 TIMELINESS 3 Lowered 7/10/20 Low: 17.4 21.3 25.7 34.9 45.3 49.0 50.3 SAFETY 1 Raised 8/71/06 LEGENDS 200 16.0 x "Cash Flow" p s 160 TECHNICAL 3 Lowered 4/16/21 Relative Price Strength 2-tor-1 split 12/12 BETA 1:15 (1.00 = Markel) 1245 Options: Yes -100 18-Month Target Price Range Shaded area indicates recession 2-For-1 80 Low-High Midpoint (% to Mid) 60 -50 $91-$212 $152 (10%) -40 2024-26 PROJECTIONS -30 Ann'l Total -20 (+30% % TOT. RETURN 3/21 VL ARITH. Institutional Decisions STOCK INDEX 202020 302020 402020 Percent 30- 62.0 99.7 964 889 1065 20 3 yr. 106.1 51.6 to Sell 766 864 839 traded 10 5 yr. 128.6 100.0 Hid's 000)1 0058 1010089231023772 2005 2006 2007 2008 2009 2010 2011 2012 2013 2014 2015 2016 2017 2018 2019 2020 2021 2022 .VALUE LINE PUB, LLC 24-26 9.82 13.17 14.16 15.98 17.85 19.25 20.91 22.73 24.95 24.01 27.45 31.10 Sales per sh A 41.85 6.54 7.22 8.10 9.48 9.87 10.97 80 86 1.04 1.06 1.15 1.30 142 1.62 1.85 2.26 2.62 3.01 2.95 3.02 2.35 3.60 4.45 "Cash Flow" per sh 9.25 56 8.00 .12 .86 .88 1.10 1.18 1 35 1.49 1.85 2.16 2 51 12 49 1.85 3.15 3.95 Earnings per sh AB .12 15 18 22 25 30 54 62 170 86 93 1.04 1.12 Div'ds Decl'd per sh CD- 1.66 12 16 16 23 23 17 .23 33 .36 .51 .56 .67 .70 .50 .60 Cap'l Spending rfar sh 85 2.69 3.03 3.49 3.98 4.48 5.04 5.18 5.67 6.24 6.22 7.41 7.29 7.55 6.13 5.77 5.17 7.75 8.30 Book Value per sh 10.65 2100.8 2072.0 2015.2 1964.4 1942.0 1936.0 1902.0 1832.0 1788.0 1740.0 1714.0 1682.0 1643.0 1601.0 1568.0 1558.0 1580.0 1565.0 Common Shs Outst'g EF| 1500.0 17.9 16.0 16.5 17.8 15.3 16.4 18.2 20.4 19.4 24.2 24.4 27.5 21.6 25.3 32.0 48.6 Bold figures are Avg Ann'l P/E Ratio 20.0 .95 .86 1.07 1.02 1.04 1.14 1.30 1.09 1.27 1.23 1.44 1.09 1.37 1.70 2.49 Value Line Relative P/E Ratio 1.10 1.2% 1.4% 1.8% 1.7% 1.5% 1.5% 1.3% 1.2% 1.0% 1.3% 1.3% 1.1% 1.0% estimates Avg Ann'l Div'd Yield 1.0% CAPITAL STRUCTURE as of 2/28/21 20862 24128 25313 27799 30601 32376 34350 36397 39117 37403 43350 48680 Sales (Smill) A 52750 Total Debt $9416 mill. Due in 5 Yrs $4500 mill. 15.1% 14.1% 14.6% 15.1% 15.6% 15.9% 15.9% 14.3% 14.0% 11.3% 14.7% 15.5% Operating Margin 20.0% LT Debt $9412 mill. LT Interest $515 mill. 975 (44% of Capital) 335.0 373.0 438.0 518.0 606.0 649.0 706.0 747.0 705.0 721.0 725 770 Depreciation ($mill) 2133.0 2223.0 2464.0 2693.0 3273.0 3760.0 4240.0 3974.0 4029.0 2937.0 4975 6200 Net Profit ($mill) 12000 Leases, Uncapitalized Annual rentals $553 mill. 25.0% 25.5% 24.7% 24.0% 22 2% 18.7% 13.2% 8.1% 16.1% 10.6% 17.0% 20.0% Income Tax Rate 21.0% No Defined Benefit Pension Plan 10.2% 9.2% 9.7% 9.7% 10.7% 11.6% 12.3% 10.9% 10.3% 7.9% 13.3% 12.7% Net Profit Margin 24.3% 339.0 7666.0 9700.0 8669.0 9642.0 9667.0 10587 9094.0 8659.0 12272 15500 Preferred Stock None 16000 Working Cap'l (Smill) 18000 Common Stock 1,579,967,074 shares 276.0 228.0 1210.0 1199.0 1079.0 2010.0 3471.0 3468.0 3464.0 9406.0 9300 8500 Long-Term Debt ($mill) 5000 Class A shares: 305,011,252 9843.0 10381 11156 10824 12707 12258 12407 9812.0 9040.0 8055.0 0 12200 13000 Shr. Equity (Smill) 16000 Class B shares: 1,274,955,822 21.1% 21.0% 20.0% 22.6% 23.8% 26.5% 26.9% 30.3% 32.7% 17.6% 24.5% 30.0% Return on Total Cap'l 58.0% 21.7% 21.4% 22.1% 24.9% 25.8% 30.7% 34.2% 40.5% MARKET CAP: $216 billion (Large Cap) 44.6% 36.5% 41.09% 47.5% Return on Shr. Equity 75.0% 16.0% 15.5% 15.8% 17.5% 18.7% 22.3% 25.0% 27.8% 29.8% 18.4% 27.5% 34.0% Retained to Com Eq 59.5% 37.300 22 as tv GA MacBook Air F1 F2 BO F3 988 F5 F6 F7 F8 DD F9 F10 @ # $ % A 2 & 3 4 5 6 8 9 0 W E R T Y U O S D F G H Khttps/ilearn.ucr.ed View 1 page 21.1% 21.0% 20.0% 22.6% 23.8% 26.5% 26.9%% |30.3% 32.7% |17.6% |24.5% 30.0% Return on Total Cap1 58.0% Class B shares: 1,274,955,822 21.7% 21.4% 22.1% 24.9% 25.8% 30.7%% 34.2% 40.5% 44.6% 36.5% 41.0% 47.5% Return on Shr. Equity 75.0% MARKET CAP: $216 billion (Large Cap) 16.0% 15.5% 15.8% 17.5% 18.7% 22.3%% 25.0% 27.8% 29.8% 18.4% 27.5% 34.0% Retained to Com Eq 59.5% 27% 31 33% 49% 33% 28% All Div'ds to Net Prof 21% CURRENT POSITION 2019 2020 2/28/21 26% 28% 29% 30% 27% 27% ($MILL) Cash Assets 4863 8787 12528 BUSINESS: NIKE designs, develops, and markets footwear, ap- is another product line for kids. Has about 76,700 employees (in Receivables, 2149 parel, equipment, and accessories. Sells products to retail ac- cluding part-timers). Swoosh, LLC, owns 74.9% Cl. A shares, Inventory (LIFO) 5622 7367 counts, through NIKE-owned stores and the Internet, and through a 15.9% Cl. B; offs./dirs., 3.8% of Cl. B; Vanguard, 8.6%; BlackRock, Other 1968 1653 1 810 mix of independent distributors and licensees in numerous coun- 7.2% (7/20 proxy). Chairman: Mark G. Parker. CEO: John Current Assets 16525 20556 24700 Accts Payable 2612 2248 2257 tries. Offerings are focused in six categories: running, basketball, Donahoe. Inc.: Oregon. Addr.: One Bowerman Drive, Beaverton, Debt Due 15 251 the Jordan brand, football (soccer), training, and sportswear. There OR 97005. Tel.: 503-671-6453. Internet: www.nikeinc.com. Other 5239 5785 6633 8284 8894 NIKE's fiscal third-quarter report would be an all-time record for the swoosh, Current Liab. 866 (years end May 31st) did not sit well and quite the accomplishment given the ANNUAL RATES Past Past Est'd '18-"20 with the investment community. backdrop of the world's largest health of change (per sh) 5 Yrs. to 24-26 Sales 9.5% 8.5% 10.0% Shares of the footwear titan had been crisis in a century. The company's digital "Cash Flow" 10.0% 7.5% 21.0% trending higher in the days leading up to presence shined brightly given the lock- Earnings 9.5% 7.5% 24.0% Dividends 13 50% 13.0% 12.0% the release of February-period financials, down conditions around the globe, and its Book Value 2.5% -3.0% and so too were expectations for both sales NIKE Direct plan, where sales go directly Fiscal and earnings. This likely contributed to to consumers and avoid third-party QUARTERLY SALES ($ mill.) A Year the selloff that followed the announcement retailers, have margins heading north. Ends Aug.31 Nov.30 Feb.28 May 31 2018 9070 8554 36397 of results that were a mixed bag. Sales of We are introducing a fiscal 2022 8984 9789 2019 9948 9374 9611 10184 39117 $10.4 billion missed the mark of $11.0 bil- share-net target that equates to 25% 2020 10660 10326 10104 6313 37403 lion, while earnings came in at $0.90 a growth from our expected level in the 2021 10594 11243 10357 11156 43350 share versus a consensus of $0.75. Digital previous year. There appears to be no 2022 12325 12495 11650 12210 48680 sales continued to rise sharply, but took a reason why earnings cannot reach another EARNINGS PER SHARE AB Full step back from the feverish pace of earlier record high next fiscal year as the swoosh Ends Aug.31 Nov.30 Feb.28 May 31 this fiscal year. Too, supply chain issues starts firing on all cylinders coming out of 2018 .57 46 .68 .69 2.40 tied to problems at ports brought down the pandemic. Growth around the world 2019 67 52 .68 62 2.49 receipts in the North American market. has been handsome, led by a growing 2020 86 .70 78 d.51 1.85 Wall Street follows this key metric closely, presence in China, where a growing rela- 2021 95 78 90 .52 3.15 and the quotation started sliding when the tionship with the NBA has bore fruit. Here 2022 1.15 1.00 1.10 .70 3.95 reading did not meet expectations. Also, at home, we look for online sales to remain QUARTERLY DIVIDENDS PAID . the stock had been up 80% in the last elevated given customization/specification endar Mar.31 Jun.30 Sep.30 Dec.31 Year year, so profit taking played a role. options that are unparalleled. 2017 Our earnings estimate for fiscal 2021 18 .18 -18 .18 These high-quality, neutrally ranked 2018 20 20 .20 20 .80 -/2 is up by a dime per share, to $3.15. shares are not all that appealing at 2019 22 22 22 .88 After factoring in the $0.15 beat in the recent price points. We advise sub- 2020 245 245 245 245 198 February quarter and our $0.05 trim on scribers to await a better entry point. 2021 275 275 the May quarter, we land at $3.15, which Erik M. Manning April 23, 2021 (A) Fiscal years end May 31st. (B) Diluted earnings. Excludes nonrecurring: 07, 2c; '08, change in share count. Next egs. report due late June. available. (D) Includes 21c dividend paid De- Company's Financial Strength 8c; '09, (13c); '13, 1c; 18, ($1.23) due to tax cember 2012. (E) In millions, adjusted for Att Stock's Price Stability 75 law change; '20, (25c). May not sum due to C) Dividends historically paid in early January, splits. (F) Each share of Class A is convertible April, July, and October. = Reinvestment plan to one share of Class B. Price Growth Persistence 90 75 2021 Value Line, Inc. All rights reserved. Factual material is obtained from sources believed to be reliable and is provided without warranties of any kind. Earnings Predictability THE PUBLISHER IS NOT RESPONSIBLE FOR ANY ERRORS OR OMISSIONS HEREIN. This publication is strictly for subscriber's own, non-commercial, internal use. No part of it may be reproduced, resold, stored or transmitted in any printed, electronic or other form, or used for generating or marketing any printed or electronic publication, service or product. To subscribe call 1-800-VALUELINE 37.309) 22 tv GA MacBook Air F1 F2 F3 F5 - - F6 F7 F8 DD F9 F10 @ # $ % & 2 3 4 5 8 9 O Q W E R T Y U O D F G H K L