Answered step by step
Verified Expert Solution
Question
1 Approved Answer
At a local college, 55 female students were randomly selected and it was found that their mean monthly income was $638 with a population
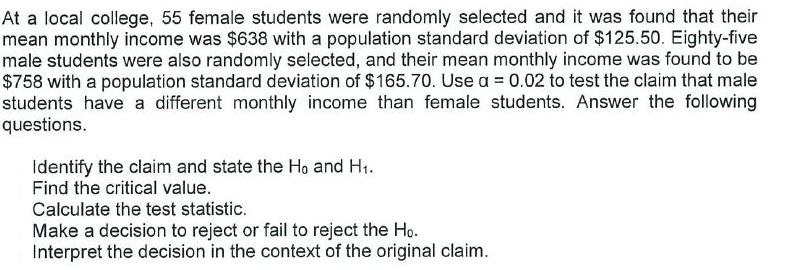
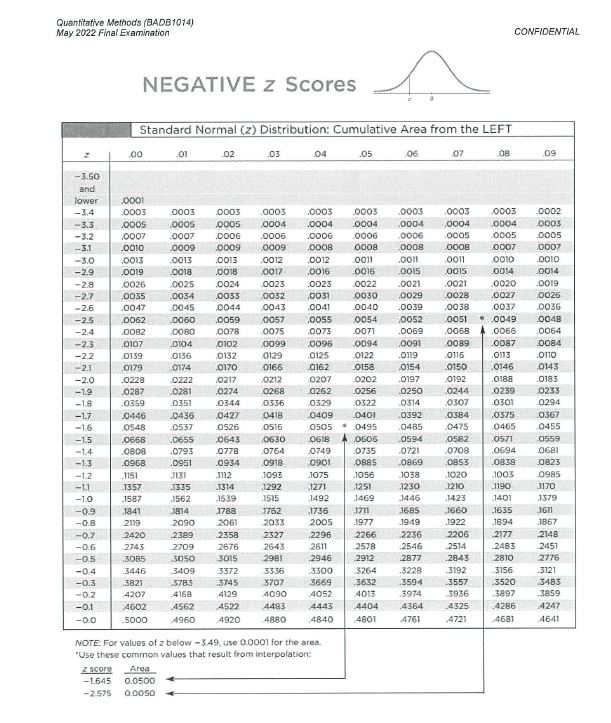
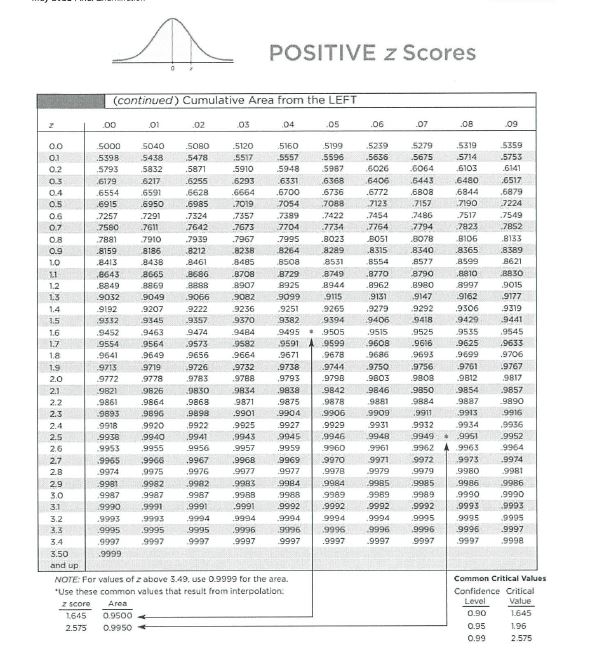
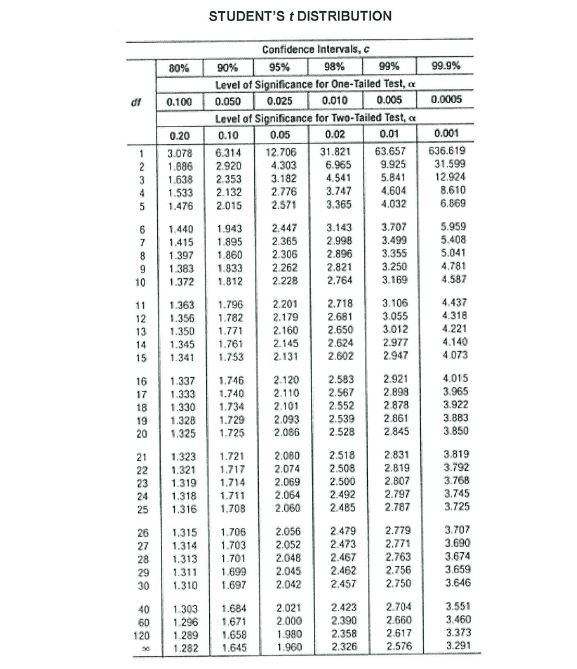
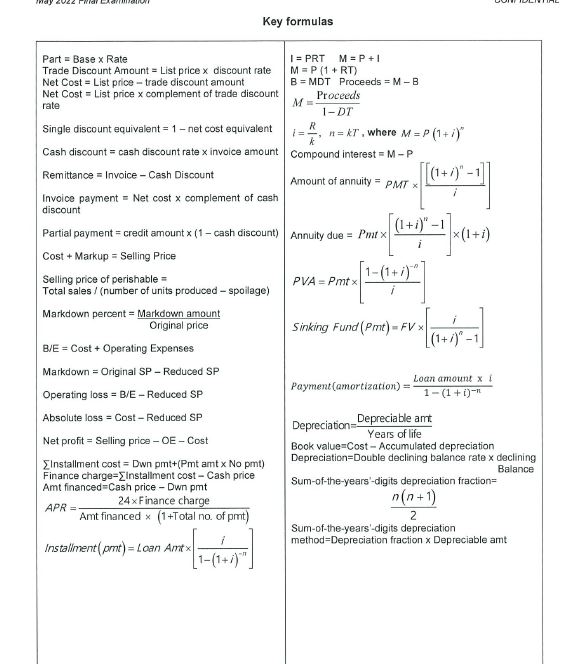
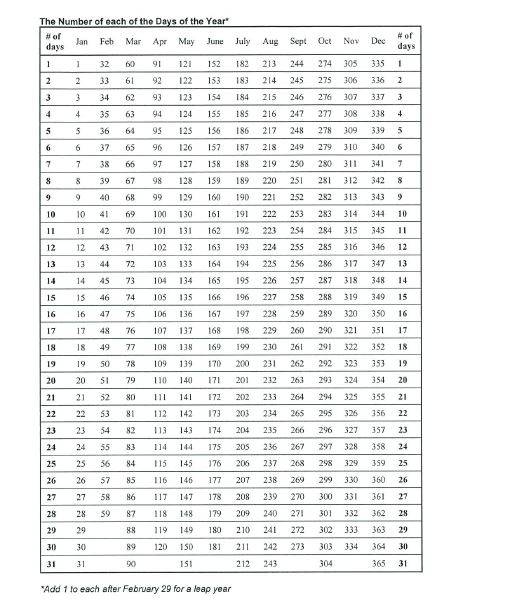
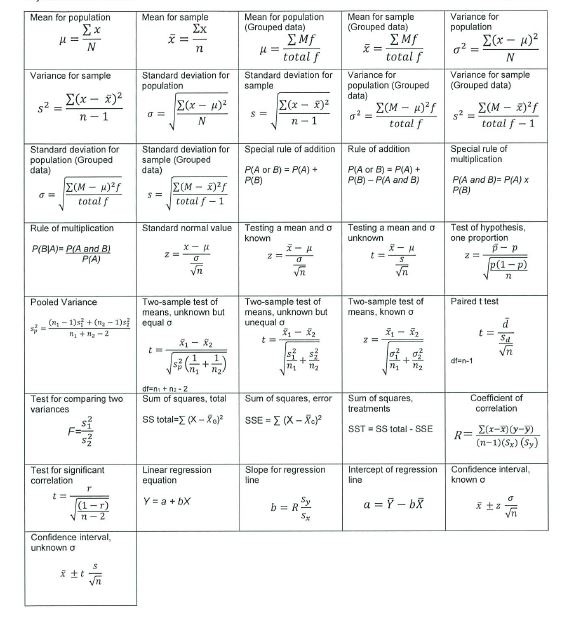
At a local college, 55 female students were randomly selected and it was found that their mean monthly income was $638 with a population standard deviation of $125.50. Eighty-five male students were also randomly selected, and their mean monthly income was found to be $758 with a population standard deviation of $165.70. Use a = 0.02 to test the claim that male students have a different monthly income than female students. Answer the following questions. Identify the claim and state the Ho and H. Find the critical value. Calculate the test statistic. Make a decision to reject or fail to reject the Ho. Interpret the decision in the context of the original claim. Quantitative Methods (BADB1014) May 2022 Final Examination NEGATIVE Z Scores Standard Normal (2) Distribution: Cumulative Area from the LEFT CONFIDENTIAL .00 .01 02 .03 04 .05 06 07 .08 .09 -3.50 and lower .0001 -3.4 .0003 .0003 .0003 .0003 .0003 .0003 .0003 .0003 .0003 .0002 -3.3 .0005 .0005 .0005 .0004 .0004 .0004 .0004 .0004 0004 .0003 -3.2 .0007 .0007 .0006 .0006 .0006 .0006 .0006 0005 .0005 .0005 -3.1 .0010 .0009 .0009 .0009 .0008 0008 .0008 .0008 .0007 .0007 -3.0 .0013 .0013 .0013 .0012 .0012 .0011 .0011 .0011 0010 .0010 -2.9 .0019 .0018 .0018 .0017 .0016 .0016 .0015 .0015 .0014 0014 -2.8 .0026 .0025 .0024 .0023 .0023 .0022 .0021 .0021 .0020 .0019 -2.7 .0035 .0034 .0033 .0032 .0031 0030 .0029 0028 .0027 .0026 -2.6 .0047 0045 0044 0043 .0041 0040 .0039 .0038 .0037 .0036 -2.5 .0062 0060 .0059 0057 .0055 0054 .0052 0051 .0049 .0048 -2.4 .0082 .0080 0078 0075 .0073 .0071 .0069 .0068 .0066 .0064 -2.3 .0107 0104 .0102 .0099 0096 0094 .0091 .0089 .0087 0084 -2.2 .0139 .0136 0132 0129 0125 0122 .0119 0116 0113 .0110 -2.1 0179 0174 0170 0166 .0162 0158 0154 0150 0146 0143 -2.0 .0228 .0222 0217 0212 0207 0202 .0197 0192 0188 0183 -1.9 .0287 .0281 0274 0268 .0262 0256 0250 .0244 0239 0233 -1.8 .0359 .0351 0344 0336 0329 0322 0314 .0307 0301 0294 -1.7 0446 .0436 0427 0418 .0409 0401 .0392 .0384 0575 0367 -1.6 0548 .0537 0526 0516 0505 0495 .0485 0475 0465 0455 -1.5 .0668 .0655 0643 0630 0618 0606 .0594 .0582 0571 0559 -14 .0808 .0793 .0778 0764 0749 0735 0721 .0708 0694 0681 -1.3 0968 .0951 0934 0918 0901 0885 0869 0853 .0838 0823 -12 1151 1131 3112 1093 1075 1056 1038 1020 1003 0985 -11 1357 3335 1314 3292 1271 1251 3230 1210 1190 1170 -1.0 1587 1562 1539 1515 1492 1469 1446 1423 1401 1379 -0.9 1841 1814 1788 1762 1736 1711 1685 1660 1635 1611 -0.8 2119 2090 2061 2033 2005 1977 1949 1922 1894 1867 -0.7 2420 2389 2358 2327 2296 2266 2236 2206 2177 2148 -0.6 2743 2709 2676 2643 2611 2578 2546 2514 2483 2451 -0.5 3085 3050 3015 2981 2946 2912 2877 .2843 2810 2776 -0.4 3446 3409 .3372 3336 .3300 .3264 .3228 .3192 3156 .3121 -0.3 .3821 3783 3745 3707 3669 3632 3594 .3557 3520 3483 -0.2 4207 4168 4129 4090 .4052 4013 3974 3936 3897 3859 -0.1 4602 4562 4522 4483 4443 4404 .4364 4325 4286 4247 -0.0 .5000 4960 4920 4880 4840 4801 4761 4721 4681 4641 NOTE: For values of z below -3.49, use 0.0001 for the area. "Use these common values that result from interpolation: Zscore Area -1.645 0.0500 -2.575 0.0050 POSITIVE Z Scores (continued) Cumulative Area from the LEFT 2 .00 .01 .02 03 04 .05 .06 .07 .08 09 0.0 5000 5040 5080 5120 5160 5199 5239 5279 .5319 5359 0.1 .5398 5438 5478 .5517 5557 5596 .5636 5675 5714 5753 0.2 5793 5832 .5871 5910 5948 5987 6026 6064 6103 6141 0.3 6179 6217 .6255 6293 6331 .6368 6406 6443 .6480 .6517 0.4 .6554 6591 .6628 .6664 .6700 6736 .6772 6808 6844 .6879 0.5 6915 6950 .6985 7019 7054 7088 7123 .7157 7190 7224 0.6 7257 7291 .7324 7357 7389 .7422 .7454 7486 7517 7549 0.7 7580 7611 7642 7673 7704 .7734 7764 7794 7823 7852 08 .7881 7910 7939 .7967 .7995 .8023 8051 8078 8106 .8133 0.9 60 .8159 8186 8212 .8238 8264 8289 8315 .8340 .8365 8389 1.0 .8413 8438 .8461 8485 8508 8531 8554 .8577 8599 8621 1.1 ,8643 8665 8686 8708 8729 8749 .8770 8790 .8810 B830 1.2 .8849 8869 8888 8907 8925 8944 .8962 .8980 8997 9015 1.3 .9032 9049 9066 .9082 9099 9115 .9131 9147 9162 9177 1.4 9192 .9207 .9222 9236 9251 .9265 9279 9292 .9306 9319 3.5 .9332 9345 .9357 9370 9382 9394 9406 9418 9429 9441 1.6 .9452 9463 9474 9484 9495 .9505 .9515 .9525 9535 9545 1.7 9554 9564 .9573 .9582 9591 9599 9608 .9616 .9625 .9633 18 .9641 .9649 .9656 9664 .9671 9678 .9686 9693 9699 .9706 1.9 9713 9719 9726 .9732 .9738 9744 .9750 .9756 9761 .9767 2.0 9772 9778 9783 .9788 .9793 .9798 .9803 9808 9812 9817 2.1 .9821 9826 9830 9834 .9838 .9842 9846 9850 9854 .9857 2.2 .9861 .9864 .9868 9871 .9875 .9878 9881 9884 .9887 9890 2.3 .9893 .9896 .9898 .9901 9904 .9906 9909 .9911 9913 9916 2.4 9918 9920 9922 .9925 9927 .9929 9931 .9932 9934 .9936 2.5 .9938 9940 .9941 9943 9945 9946 9948 9949 . 9951 .9952 2.6 .9953 9955 9956 .9957 .9959 9960 9961 9962 9963 9964 2.7 .9965 .9966 .9967 .9968 9969 9970 9971 9972 9973 9974 2.8 9974 9975 .9976 .9977 9977 .9978 .9979 9979 9980 9981 29 9981 9982 9982 .9983 9984 9984 .9985 .9985 9986 9986 3.0 .9987 9987 .9987 .9988 9988 9989 9989 9989 9990 9990 3.1 9990 9991 9991 9991 9992 9992 9992 .9992 .9993 .9993 3.2 .9993 .9993 9994 9994 .9994 9994 .9994 9995 9995 9995 3.3 9995 9995 9995 .9996 .9996 9996 9996 9996 9996 .9997 3.4 .9997 9997 9997 .9997 9997 .9997 .9997 9997 9997 9998 3.50 .9999 and up NOTE: For values of z above 3.49, use 0.9999 for the area. *Use these common values that result from interpolation: z score Area 1645 0.9500 2.575 0.9950 Common Critical Values Confidence Critical Level Value 0.90 1.645 0.95 1.96 0.99 2.575 STUDENT'S & DISTRIBUTION 80% 90% Confidence Intervals, c 95% 98% 99% Level of Significance for One-Tailed Test, a df 0.100 0.050 0.025 0.010 0.005 Level of Significance for Two-Tailed Test, a 99.9% 0.0005 0.20 0.10 0.05 0.02 0.01 0.001 1234 in 3.078 6.314 12.706 31.821 63.657 636.619 1.886 2.920 4.303 6.965 9.925 31.599 1.638 2.353 3.182 4.541 5.841 12.924 1.533 2.132 2.776 3.747 4.604 8.610 5 1.476 2.015 2.571 3.365 4.032 6.869 08119 6 1.440 1.943 2.447 3.143 3.707 5.959 7 1.415 1.895 2.365 2.998 3.499 5.408 1.397 1.860 2.306 2.896 3.355 5.041 1.383 1.833 2.262 2.821 3.250 4.781 1.372 1.812 2.228 2.764 3.169 4.587 12315 1.363 1.796 2.201 2.718 3.106 4.437 1.356 1.782 2.179 2.681 3.055 4.318 1.350 1.771 2.160 2.650 3.012 4.221 14 1.345 1.761 2.145 2.624 2.977 4.140 1.341 1.753 2.131 2.602 2.947 4.073 16 1.337 1.746 2.120 2.583 2.921 4.015 17 1.333 1.740 2.110 2.567 2.898 3.965 18 1.330 1.734 2.101 2.552 2.878 3.922 19 1.328 1.729 2.093 2.539 2.861 3.883 20 1.325 1.725 2.086 2.528 2.845 3.850 21 1.323 1.721 2.080 2.518 2.831 3.819 22 1.321 1.717 2.074 2.508 2.819 3.792 23 1.319 1.714 2.069 2.500 2.807 3.768 24 1.318 1.711 2.064 2.492 2.797 3.745 25 1.316 1.708 2.060 2.485 2.787 3.725 26 1.315 1.706 2.056 2.479 2.779 3.707 27 1.314 1.703 2.052 2.473 2.771 3.690 28 1.313 1.701 2.048 2.467 2.763 3.674 29 1.311 1.699 2.045 2.462 2.756 3.659 30 1.310 1.697 2.042 2.457 2.750 3.646 40 1.303 1.684 2.021 2.423 2.704 3.551 60 1.296 1.671 2.000 2.390 2.660 3.460 120 1.289 1.658 1.980 2.358 2.617 3.373 30 1.282 1.645 1.960 2.326 2.576 3.291 may 2022 Key formulas Part Base x Rate Trade Discount Amount List price x discount rate Net Cost List price-trade discount amount Net Cost List price x complement of trade discount rate Single discount equivalent = 1 - net cost equivalent M = P+I 1 = PRT M = P(1+RT) B Cash discount cash discount rate x invoice amount Compound interest = M-P MDT Proceeds = M - B Proceeds M= 1-DT R ==KT, where M 1=P (1+i)" Remittance Invoice - Cash Discount Amount of annuity PMT x [(1+1)" - Invoice payment Net cost x complement of cash discount (1+i)" Partial payment credit amount x (1-cash discount) Annuity due = Pmtx (1+i) Cost + Markup Selling Price Selling price of perishable = PVA-Pmtx 1-(1+i)" Total sales/ (number of units produced - spoilage) Markdown percent = Markdown amount Sinking Fund (Pmt)- -FV x (1+)-1 Original price B/E = Cost + Operating Expenses Markdown - Original SP - Reduced SP Operating loss B/E - Reduced SP = Absolute loss Cost - Reduced SP Net profit Selling price - OE - Cost Installment cost Dwn pmt+(Pmt amt x No pmt) Finance charge-Installment cost-Cash price Amt financed Cash price - Dwn pmt APR= 24x Finance charge Amt financed (1+Total no. of pmt) Installment (pmt) Loan Amtx Payment (amortization) = Loan amount x i 1-(1+1) Depreciation Depreciable amt Years of life Book value Cost-Accumulated depreciation Depreciation Double declining balance rate x declining Sum-of-the-years'-digits depreciation fraction n(n+1) 2 Sum-of-the-years-digits depreciation Balance method-Depreciation fraction x Depreciable amt The Number of each of the Days of the Year" # of days # of Jan Feb Mar Apr May June July Aug Sept Oct Nov Dec days 1 1 32 60 91 121 152 182 213 244 274 305 335 1 2 2 331 61 92 122 153 183 214 245 275 306 336 2 3 3 34 62 93 123 154 184 215 246 276 307 337 3 4 4 35 63 94 124 155 185 216 247 277 308 338 4 5 5 36 64 95 125 156 186 217 248 278 309 339 5 6 6 37 65 96 126 157 187 218 249 279 310 340 6 7 7 38 66 97 127 158 188 219 250 280 311 341 8 8 39 67 98 128 159 189 220 251 281 312 342 8 9 9 40 68 99 129 160 190 221 252 282 313 343 9 10 10 41 69 100 130 161 191 222 253 283 3141 344 10 11 11 42 70 101 131 162 192 223 254 284 315 345 11 12 12 43 71 102 132 163 193 224 255 285 316 346 12 13 13 44 72 103 133 164 194 225 256 286 317 347 13 14 147 45 73 104 134 165 195 226 257 287 318 348 14 15 15 46 74 105 135 166 196 227 258 288 319 349 15 16 16 47 75 106 136 167 197 228 259 289 3201 350 16 17 17 48 76 107 137 168 198 229 260 290 321 351 17 18 18 49 77 108 138 169 199 230 261 291 322 352 18 19 19 50 78 109 139 170 200 231 262 292 323 353 19 20 201 51 79 110 140 171 201 232 263 293 324 354 20 21 21 52 80 111 141 172 202 233 264 294 325 355 21 22 22 53 81 112 142 173 203 234 265 295 326 356 22 23 23 54 82 113 143 174 204 235 266 296 327 357 23 24 24 55 83 114 144 175 205 236 267 297 328 358 24 25 25 56 84 115 145 176 206 237 268 298 329 359 25 26 26 57 85 116 146 177 207 238 269 299 330 360 26 27 27 58 86 117 147 178 208 239 270 300 331 361 27 28 28 59 87 118 148 179 209 240 271 301 332 362 28 29 29 88 119 149 180 210 241 272 302 333 363 29 30 30 89 120 150 181 211 242 273 303 334 364 30 31 31 90 151 212 243 304 3651 31 "Add 1 to each after February 29 for a leap year Mean for population Mean for sample == N Mean for population (Grouped data) Mean for sample (Grouped data) Variance for population x = n (x-1) x= total f total f N Variance for sample Standard deviation for population Standard deviation for sample Variance for Variance for sample population (Grouped (Grouped data) data) $2 (x-x) n-1 Standard deviation for population (Grouped data) = (x-11) N (x-x) S= 22-1 ( - 1) total f (M-x)f $2 total f-1 Standard deviation for sample (Grouped data) Special rule of addition P(A or B) = P(A) + P(B) Rule of addition P(A or B) = P(A) + P(B)-P(A and B) - 125 = S= total f (M- x) total f-1 Special rule of multiplication P(A and B)= P(A) x P(B) Rule of multiplication Standard normal value P(BIA)= P(A and B) x-1 Testing a mean and a known - P Testing a mean and o unknown Test of hypothesis, one proportion P(A) z= 20 t= z= n B-p p(1-p) n Pooled Variance (-1) + (n-1)s -2 Two-sample test of means, unknown but equal o Two-sample test of means, unknown but unequal a Two-sample test of means, known Paired t test z= t= Sd (+) 122 df-n-1 121 df=n+n-2 Test for comparing two variances Sum of squares, total SS total (X-0)2 Sum of squares, error Sum of squares, treatments Coefficient of correlation SSE = X(X-X) SST SS total - SSE (x-x)(y-y) R= (n-1)(5x) (Sy) Confidence interval, Test for significant correlation t= Linear regression equation Slope for regression Intercept of regression line line T (1-r) 11-2 Y = a + bx b = Ry a=-bX Sx Confidence interval, unknown a S n known a
Step by Step Solution
★★★★★
3.56 Rating (160 Votes )
There are 3 Steps involved in it
Step: 1
Requirement 1 Calculate the number of machine hours required to produce each unit of product ABC ...
Get Instant Access to Expert-Tailored Solutions
See step-by-step solutions with expert insights and AI powered tools for academic success
Step: 2

Step: 3

Ace Your Homework with AI
Get the answers you need in no time with our AI-driven, step-by-step assistance
Get Started


