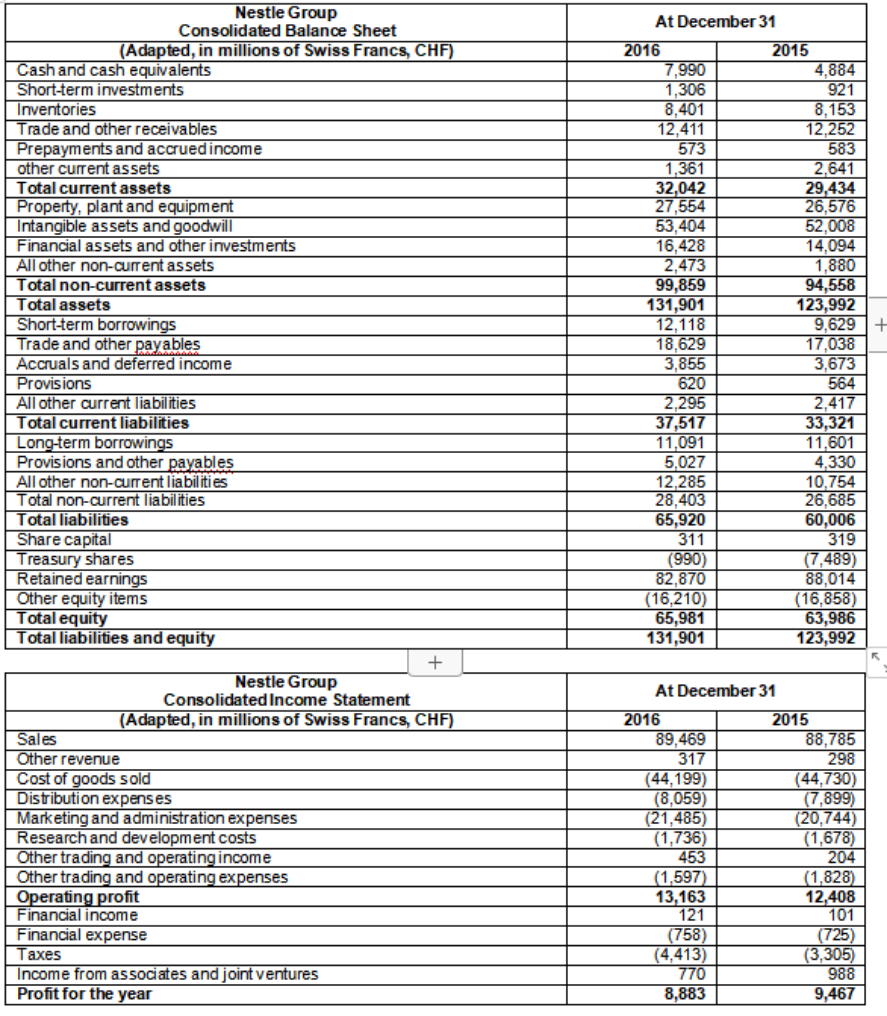
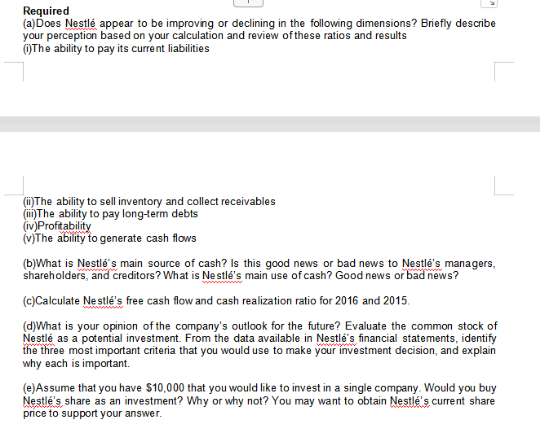
At December 31 Nestle Group Consolidated Balance Sheet (Adapted, in millions of Swiss Francs CHF) Cash and cash equivalents Short-term investments Inventories Trade and other receivables Prepayments and accrued income other current assets Total current assets Property, plant and equipment Intangible assets and goodwill Financial assets and other investments All other non-current assets Total non-current assets Total assets Short-term borrowings Trade and other payables Accruals and deferred income Provisions All other current liabilities Total current liabilities Long-term borrowings Provisions other payables All other non-current liabilities Total non-current liabilities Total liabilities Share capital Treasury shares Retained earnings Other equity items Total equity Total liabilities and equity 2016 7,990 1,306 8,401 12,411 573 1,361 32,042 27,554 53,404 16,428 2,473 99,859 131,901 12.118 18.629 3.855 620 2,295 37,517 11,091 5,027 12.285 28,403 65,920 311 (990) 82,870 (16,210) 65,981 131,901 2015 4,884 921 8,153 12.252 583 2.641 29,434 26,576 52,008 14,094 1,880 94,558 123,992 9,629 + 17,038 3,673 564 2,417 33,321 11,601 4,330 10.754 26.685 60,006 319 (7,489) 88,014 (16,858) 63,986 123,992 + At December 31 Nestle Group Consolidated Income Statement (Adapted, in millions of Swiss Francs, CHF) Sales Other revenue Cost of goods sold Distribution expenses Marketing and administration expenses Research and development costs Other trading and operating income Other trading and operating expenses Operating profit Financial income Financial expense Taxes Income from associates and joint ventures Profit for the year 2016 89,469 317 (44,199) (8,059) (21,485) (1,736) 453 (1,597) 13,163 121 (758 (4,413) 770 8,883 2015 88,785 298 (44,730) (7,899) (20,744) (1,678) 204 (1,828) 12,408 101 (725) (3,305) 988 9,467 Required (a) Does Nestl appear to be improving or declining in the following dimensions? Briefly describe your perception based on your calculation and review of these ratios and results The ability to pay its current liabilities @The ability to sell inventory and collect receivables The ability to pay long-term debts (iv)Profitability (v)The ability to generate cash flows (b)What is Nestle's main source of cash? Is this good news or bad news to Nestle's managers, shareholders, and creditors? What is Nestle's main use of cash? Good news or bad news? (c)Calculate Nestl's free cash flow and cash realization ratio for 2016 and 2015. (d)What is your opinion of the company's outlook for the future? Evaluate the common stock of Nestle as a potential investment. From the data available in Nestle's financial statements, identify the three most important criteria that you would use to make your investment decision, and explain why each is important (e)Assume that you have $10,000 that you would like to invest in a single company. Would you buy Nestl's share as an investment? Why or why not? You may want to obtain Nestl's current share pnce to support your