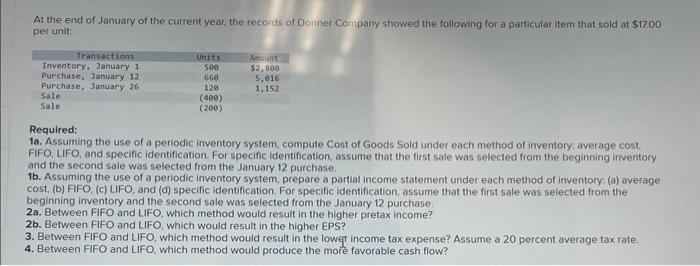
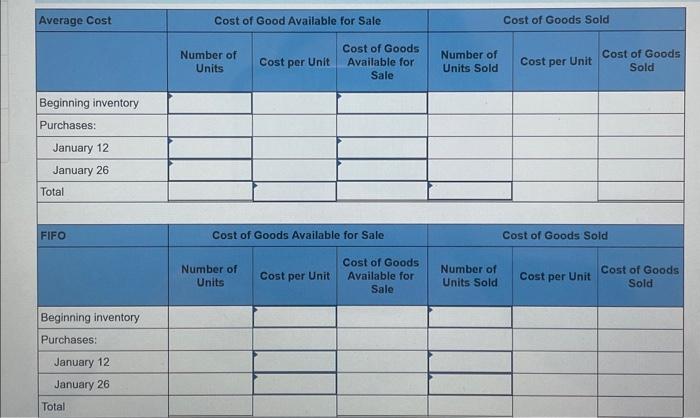
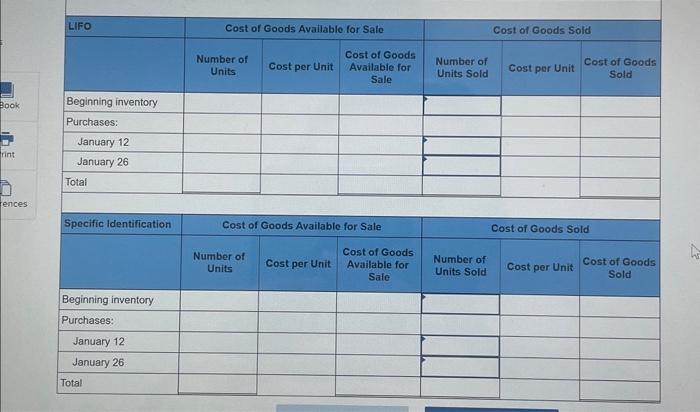
At the end of January of the current year, the records of Domner Company showed the followng for a particular item that sold at $1700 per unit: Required: 1a. Assuming the use of a periodic inventory system, compute Cost of Goods Sold under each method of inventory, average cost. FIFO, LIFO, and specific identification. For specific identification, assume that the first sale was selected from the beginning inventory and the second sale was selected from the January 12 purchase. 1b. Assuming the use of a periodic inventory system, prepare a partial income statement under each method of inventory: (a) average cost, (b) FFO, (c) LIFO, and (d) specific identification. For specific identification, assume that the first sale was selected from the beginning inventory and the second sale was selected from the January 12 purchase. 2a. Between FIFO and LIFO, which method would result in the higher pretax income? 2b. Between FIFO and LIFO, which would result in the higher EPS? 3. Between FIFO and LIFO, which method would result in the lowet income tax expense? Assume a 20 percent average tax rate. 4. Between FIFO and LIFO, which method would produce the more favorable cash flow? \begin{tabular}{|c|c|c|c|c|c|c|} \hline \multirow[t]{2}{*}{ LIFO } & \multicolumn{3}{|c|}{ Cost of Goods Available for Sale } & \multicolumn{3}{|c|}{ Cost of Goods Sold } \\ \hline & \begin{tabular}{c} Number of \\ Units \end{tabular} & Cost per Unit & \begin{tabular}{l} Cost of Goods \\ Available for \\ Sale \end{tabular} & \begin{tabular}{l} Number of \\ Units Sold \end{tabular} & Cost per Unit & \begin{tabular}{l} Cost of Goods \\ Sold \end{tabular} \\ \hline \multicolumn{7}{|l|}{ Beginning inventory } \\ \hline \multicolumn{7}{|l|}{ Purchases: } \\ \hline \multicolumn{7}{|l|}{ January 12} \\ \hline \multicolumn{7}{|l|}{ January 26} \\ \hline \multicolumn{7}{|l|}{ Total } \\ \hline \multirow[t]{2}{*}{ Specific Identification } & \multicolumn{3}{|c|}{ Cost of Goods Available for Sale } & \multicolumn{3}{|c|}{ Cost of Goods Sold } \\ \hline & \begin{tabular}{l} Number of \\ Units \end{tabular} & Cost per Unit & \begin{tabular}{c} Cost of Goods \\ Available for \\ Sale \end{tabular} & \begin{tabular}{l} Number of \\ Units Sold \end{tabular} & Cost per Unit & \begin{tabular}{c} Cost of Goods \\ Sold \end{tabular} \\ \hline \multicolumn{7}{|l|}{ Beginning inventory } \\ \hline \multicolumn{7}{|l|}{ Purchases: } \\ \hline \multicolumn{7}{|l|}{ January 12} \\ \hline \multicolumn{7}{|l|}{ January 26} \\ \hline Total & & & & & & \\ \hline \end{tabular} \begin{tabular}{|c|c|c|c|c|c|c|} \hline \multirow[t]{2}{*}{ Average Cost } & \multicolumn{3}{|c|}{ Cost of Good Available for Sale } & \multicolumn{3}{|c|}{ Cost of Goods Sold } \\ \hline & \begin{tabular}{c} Number of \\ Units \end{tabular} & Cost per Unit & \begin{tabular}{l} Cost of Goods \\ Available for \\ Sale \end{tabular} & \begin{tabular}{l} Number of \\ Units Sold \end{tabular} & Cost per Unit & \begin{tabular}{c} Cost of Goods \\ Sold \end{tabular} \\ \hline \multicolumn{7}{|l|}{ Beginning inventory } \\ \hline \multicolumn{7}{|l|}{ Purchases: } \\ \hline \multicolumn{7}{|l|}{ January 12} \\ \hline \multicolumn{7}{|l|}{ January 26} \\ \hline \multicolumn{7}{|l|}{ Total } \\ \hline \multirow[t]{2}{*}{ FIFO } & \multicolumn{3}{|c|}{ Cost of Goods Available for Sale } & \multicolumn{3}{|c|}{ Cost of Goods Sold } \\ \hline & \begin{tabular}{c} Number of \\ Units \end{tabular} & Cost per Unit & \begin{tabular}{c} Cost of Goods \\ Available for \\ Sale \end{tabular} & \begin{tabular}{l} Number of \\ Units Sold \end{tabular} & Cost per Unit & \begin{tabular}{l} Cost of Goods \\ Sold \end{tabular} \\ \hline \multicolumn{7}{|l|}{ Beginning inventory } \\ \hline \multicolumn{7}{|l|}{ Purchases: } \\ \hline \multicolumn{7}{|l|}{ January 12} \\ \hline \multicolumn{7}{|l|}{ January 26} \\ \hline Total & & & & & & \\ \hline \end{tabular}