Question
At the end of the semester, the instructors for a Statics course compile their final grades into a single spreadsheet to determine the general performance
At the end of the semester, the instructors for a Statics course compile their final grades into a single spreadsheet to determine the general performance of students for their course. These instructors are responsible for ten sections of the course in total.
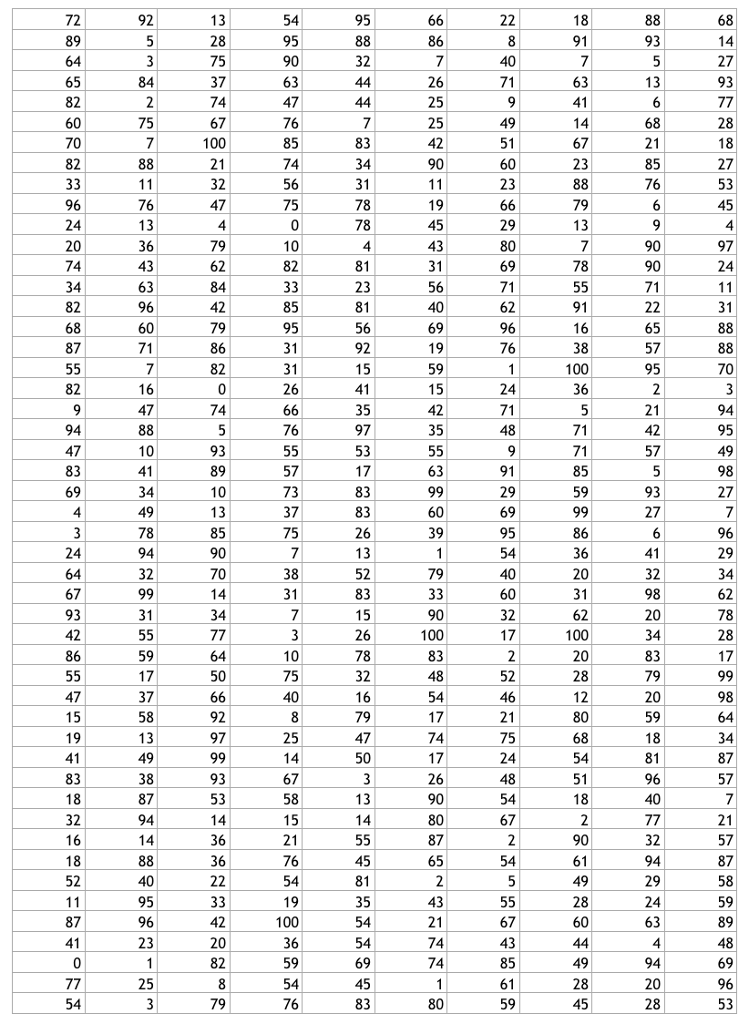
It is assumed that each section contains 49 students. The attached Excel spreadsheet contains data arranged in 10 columns where each column represents each section. As there are 49 students in each section, each column will also have 49 rows. Each number in each cell represents the final grade that a student has earned for the course.
Write a MATLAB script to do the following:
Import the entire Excel spreadsheet data into MATLAB
Compute the average final grade for each section
Compute the standard deviation of the final grade for each section
Compute the global average final grade (that is the average final grade of all 490 students)
Compute the global standard deviation of the final grade
Your MATLAB script must also complete the following tasks:
Display the average and standard deviation of the final grades for each section in the form of a table
Display the maximum and minimum final grades for each section on the same table
Plot a histogram of the data using the histogram function on MATLAB
Note 1: Ensure that you follow MATLAB naming rules for variable and file names
Note 2: Insert comments wherever appropriate for clarity of your program
Note 3: Your script must have no syntax errors; if it fails to run then no points will be given.
Step by Step Solution
There are 3 Steps involved in it
Step: 1

Get Instant Access to Expert-Tailored Solutions
See step-by-step solutions with expert insights and AI powered tools for academic success
Step: 2

Step: 3

Ace Your Homework with AI
Get the answers you need in no time with our AI-driven, step-by-step assistance
Get Started


