Answered step by step
Verified Expert Solution
Link Copied!

Question

1 Approved Answer

At the snapshot below, you can see results from the second pass (cross- sectional) regression, where the estimated CAPM-beta from the first pass (time series)

At the snapshot below, you can see results from the second pass (cross- sectional) regression, where the estimated CAPM-beta from the first pass (time series) together with book-to-market and idiosyncratic volatility are related to average stock return. Write down the regression equation that was estimated in Excel. Interpret the results and conclude (based on the results) whether CAPM holds.
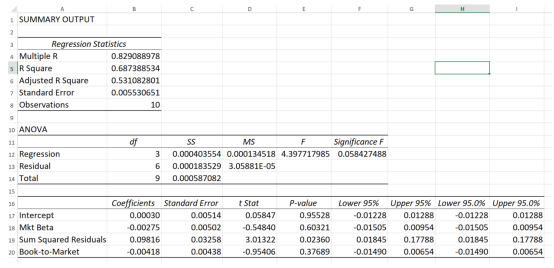
image text in transcribed

H SUMMARY OUTPUT Regression Statistics Multiple R 0.829088978 R Square 0.687388534 Adjusted R Square 0.531082801 7 Standard Error 0.005530651 Observations 10 df 10 ANOVA 11 12 Regression u Residual 3 Total 15 3 6 9 SS MS F Significance F 0.000403554 0.000134518 4.397717985 0.058427488 0.000183529 3.05881E-05 0.000587082 15 17 Intercept 1 Mit Beta 19 Sum Squared Residuals 20 Book-to-Market Coefficients Standard Error 0.00030 0.00514 -0.00275 0.00502 0.09816 0.03258 -0.00418 0.00438 Stot 0.05847 -0.54840 3.01322 -0.95406 P-value 0.95528 0.60321 0.02360 0.37689 Lower 95% Upper 95% Lower 95.0% Upper 95.0% -0.01228 0.01288 -0.01228 0.01288 -0.01505 0.00954 -0.01505 0.00954 0.01845 0.17788 0.01845 0.17788 -0.01490 0.00654 -0.01490 0.00654 H SUMMARY OUTPUT Regression Statistics Multiple R 0.829088978 R Square 0.687388534 Adjusted R Square 0.531082801 7 Standard Error 0.005530651 Observations 10 df 10 ANOVA 11 12 Regression u Residual 3 Total 15 3 6 9 SS MS F Significance F 0.000403554 0.000134518 4.397717985 0.058427488 0.000183529 3.05881E-05 0.000587082 15 17 Intercept 1 Mit Beta 19 Sum Squared Residuals 20 Book-to-Market Coefficients Standard Error 0.00030 0.00514 -0.00275 0.00502 0.09816 0.03258 -0.00418 0.00438 Stot 0.05847 -0.54840 3.01322 -0.95406 P-value 0.95528 0.60321 0.02360 0.37689 Lower 95% Upper 95% Lower 95.0% Upper 95.0% -0.01228 0.01288 -0.01228 0.01288 -0.01505 0.00954 -0.01505 0.00954 0.01845 0.17788 0.01845 0.17788 -0.01490 0.00654 -0.01490 0.00654

Step by Step Solution

There are 3 Steps involved in it

Step: 1

blur-text-image

Get Instant Access to Expert-Tailored Solutions

See step-by-step solutions with expert insights and AI powered tools for academic success

Step: 2

blur-text-image

Step: 3

blur-text-image

Ace Your Homework with AI

Get the answers you need in no time with our AI-driven, step-by-step assistance

Get Started

Recommended Textbook for

Financial Markets And Institutions

Authors: Frederic S. Mishkin, Stanley G. Eakins

7th Edition

013213683X, 978-0132136839

More Books

Students also viewed these Finance questions

Question

7. Outline the paper, adding as much detail as possible.

Answered: 1 week ago