Answered step by step
Verified Expert Solution
Link Copied!

Question

1 Approved Answer

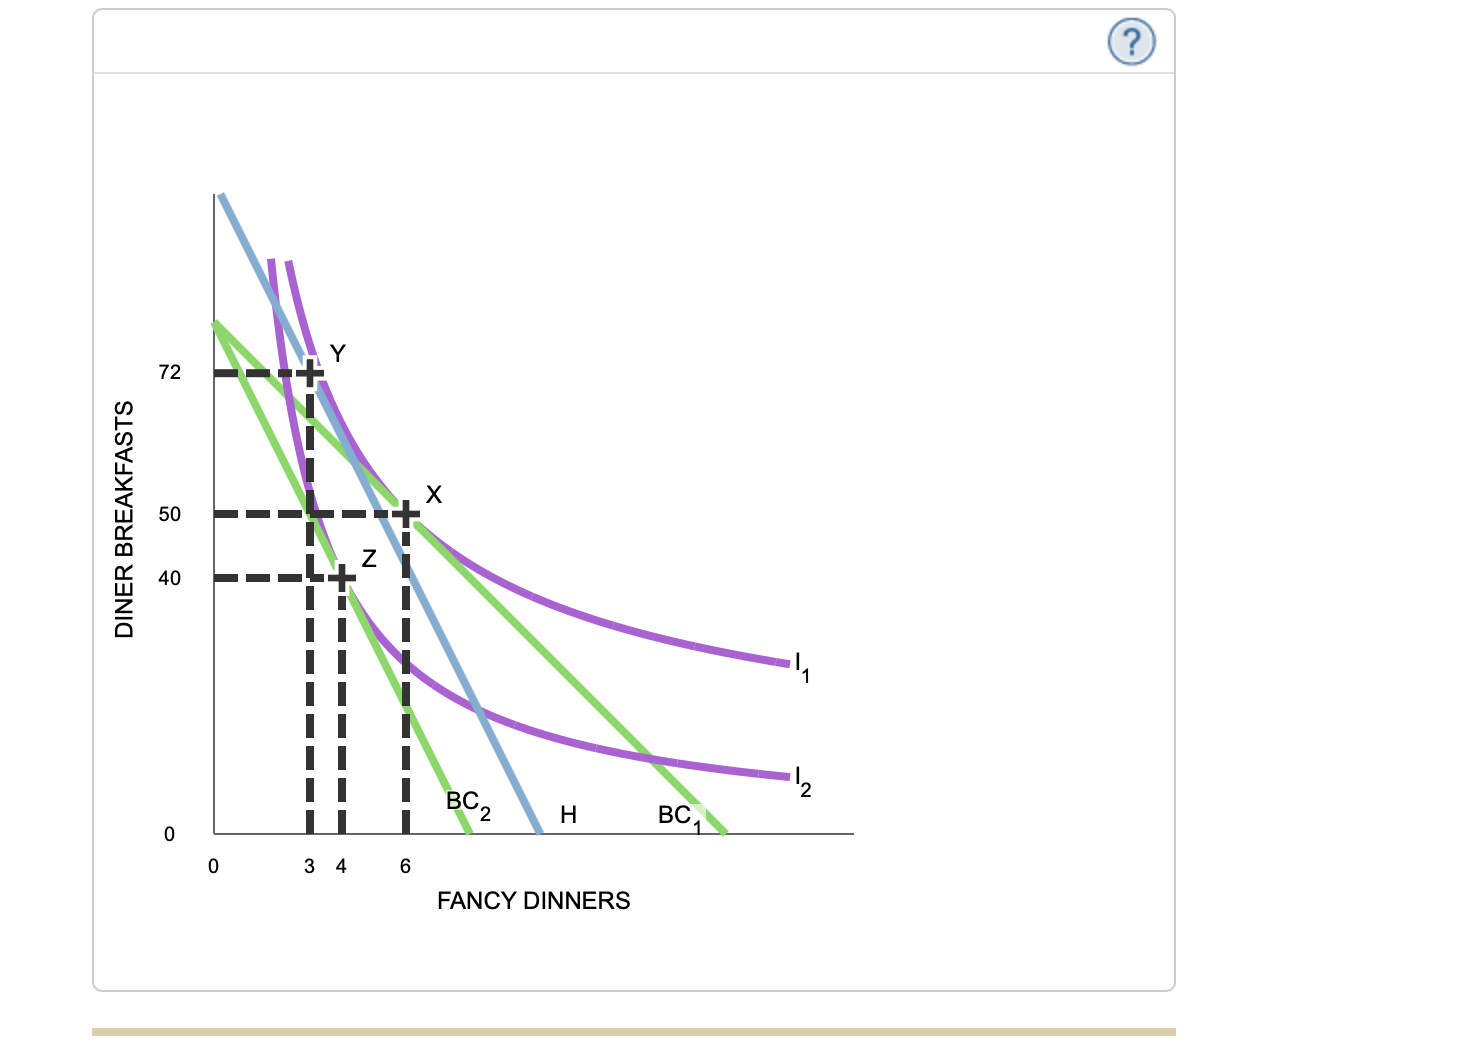
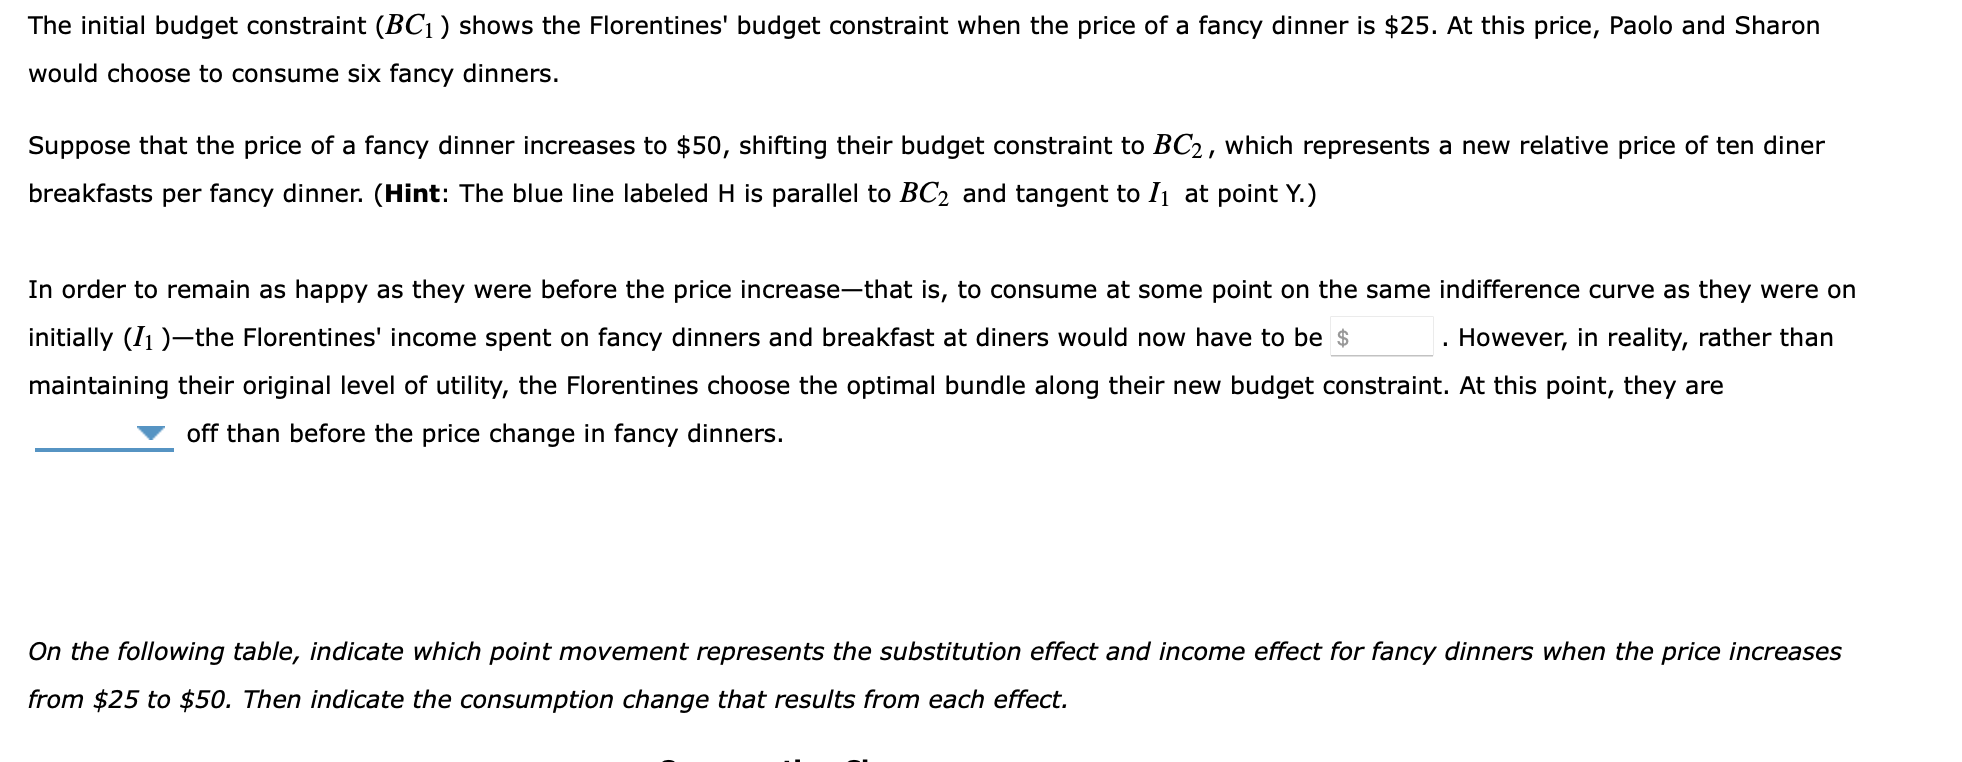
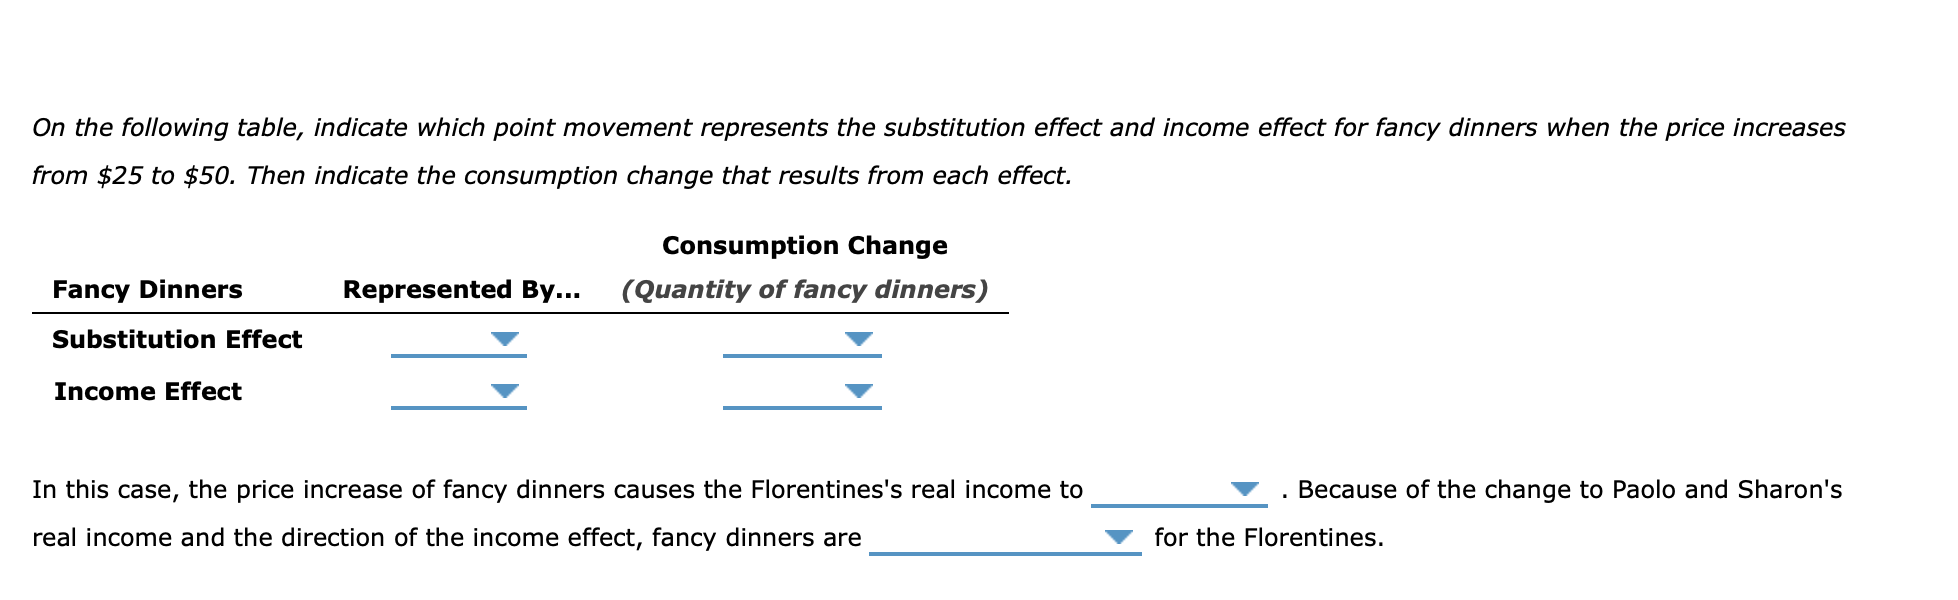
At this point ... Better or Worse? Attempts: 0 I I Keep the Highest: 0/3 9. Income and substitution effects Paolo and Sharon Florentine live

At this point ... Better or Worse?

image text in transcribedimage text in transcribedimage text in transcribedimage text in transcribed
Attempts: 0 I I Keep the Highest: 0/3 9. Income and substitution effects Paolo and Sharon Florentine live in Denver and enjoy going out to fancy restaurants for dinner and to diners for breakfast. On the following diagram, the purple curves [1 and 12 represent two of their indifference curves for fancy dinners and diner breakfasts. They have $400 per month available to spend on eating out. The price of a diner breakfast is always $5. Each labeled point represents the tangency between a budget constraint and the corresponding indifference curve. \fThe initial budget constraint (BC1) shows the Florentines' budget constraint when the price of a fancy dinner is $25. At this price, Paolo and Sharon would choose to consume six fancy dinners. Suppose that the price of a fancy dinner increases to $50, shifting their budget constraint to 8C2 , which represents a new relative price of ten diner breakfasts per fancy dinner. (Hint: The blue line labeled H is parallel to BC2 and tangent to 11 at point Y.) In order to remain as happy as they were before the price increasethat is, to consume at some point on the same indifference curve as they were on initially (11 )the Florentines' income spent on fancy dinners and breakfast at diners would now have to be :5 . However, in reality, rather than maintaining their original level of utility, the Florentines choose the optimal bundle along their new budget constraint. At this point, they are 7 off than before the price change in fancy dinners. 0n the following table, indicate which point movement represents the substitution effect and income effect for fancy dinners when the price increases from $25 to $50. Then indicate the consumption change that results from each effect. 0n the following table, indicate which point movement represents the substitution effect and income e'ect for fancy dinners when the price increases from $25 to $50. Then indicate the consumption change that results from each effect. Consumption Change Fancy Dinners Represented By... ( Quantity of fancy dinners) Substitution Effect V V Income Effect v v In this case, the price increase of fancy dinners causes the Florentines's real income to v . Because of the change to Paolo and Sharon's real income and the direction of the income effect, fancy dinners are V for the Florentines

Step by Step Solution

There are 3 Steps involved in it

Step: 1

blur-text-image

Get Instant Access to Expert-Tailored Solutions

See step-by-step solutions with expert insights and AI powered tools for academic success

Step: 2

blur-text-image

Step: 3

blur-text-image

Ace Your Homework with AI

Get the answers you need in no time with our AI-driven, step-by-step assistance

Get Started

Recommended Textbook for

Macroeconomics Principles and Applications

Authors: Robert e. hall, marc Lieberman

5th edition

1111397465, 9781439038970, 1439038988, 978-1111397463, 143903897X, 9781439038987, 978-1133265238

Students also viewed these Economics questions