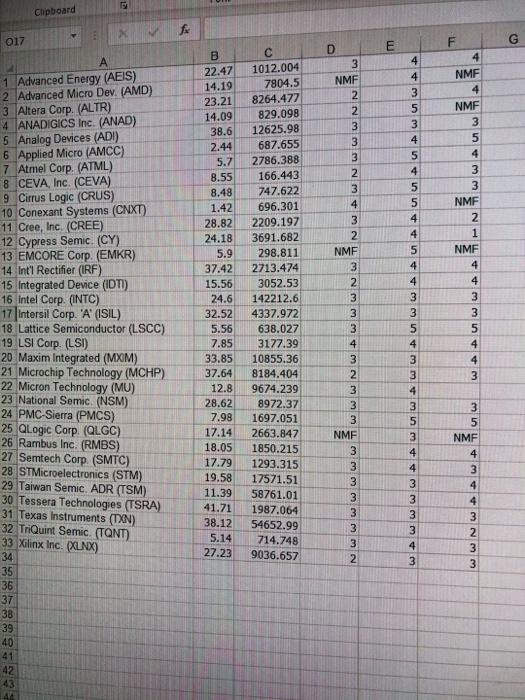
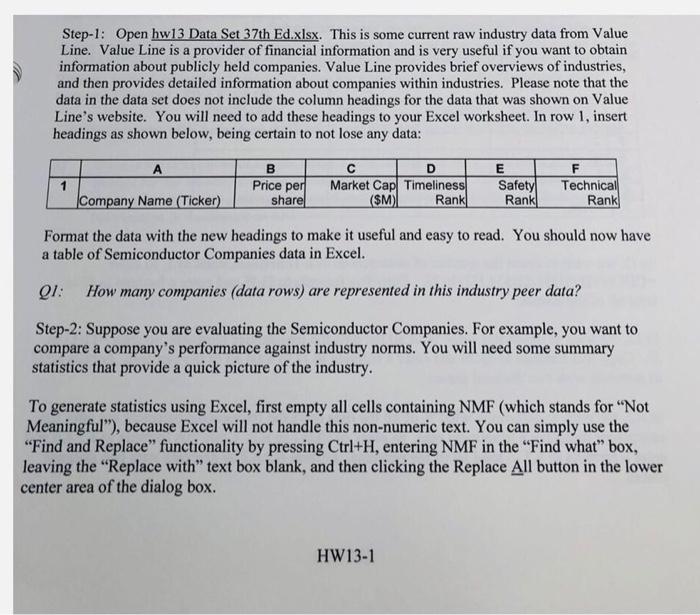
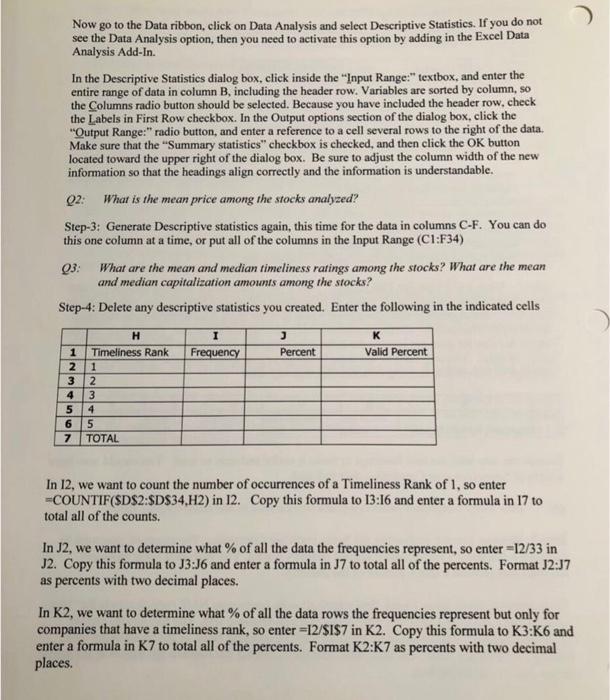
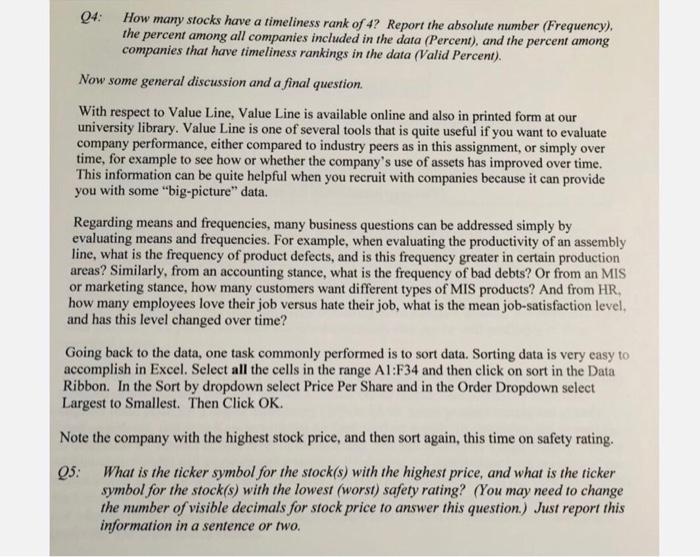
ats | M tamilstaarnamalar - alar - to -lay tart verb Dia OH - Clipboard fia 017 F G E D 3 NMF 2 2 3 4 4 3 5 3 4 5 4 5 3 4 3 2 NMF 3 2 4 5 4 B 22.47 14.19 23.21 14.09 38.6 2.44 5.7 8.55 8.48 1.42 28.82 24.18 5.9 37.42 15.56 24.6 32.52 5.56 7.85 33.85 37.64 12.8 28.62 7.98 17.14 18.05 17.79 19.58 11.39 41.71 38.12 5.14 27.23 4 NMF 4 NMF 3 5 4 3 3 NMF 2 1 NMF 4 4 3 3 5 4 4 3 1012.004 7804.5 8264.477 829.098 12625.98 687.655 2786.388 166.443 747.622 696.301 2209.197 3691.682 298.811 2713.474 3052.53 142212.6 4337.972 638.027 3177.39 10855.36 8184.404 9674.239 8972.37 1697.051 2663.847 1850.215 1293.315 17571.51 58761.01 1987.064 54652.99 714.748 9036.657 11. Advanced Energy (AEIS) 2 Advanced Micro Dev. (AMD) 3. Altera Corp. (ALTR) 4 ANADIGICS Inc. (ANAD) 5 Analog Devices (ADI) 6 Applied Micro (AMCC) 7 Atmel Corp. (ATML) 8 CEVA, Inc. (CEVA) 9 Cirrus Logic (CRUS) 10 Conexant Systems (CNXT) 11 Cree, Inc. (CREE) 12 Cypress Semic (CY) 13 EMCORE Corp. (EMKR) 14 Int'l Rectifier (IRF) 15 Integrated Device (IDTI) 16 Intel Corp. (INTC) 17 Intersil Corp. 'A' (ISIL) 18 Lattice Semiconductor (LSCC) 19 LSI Corp. (LSI) 20 Maxim Integrated (MXIM) 21 Microchip Technology (MCHP) 22 Micron Technology (MU) 23 National Semic (NSM) 24 PMC Sierra (PMCS) 25 QLogic Corp. (QLGC) 26 Rambus Inc. (RMBS) 27 Semtech Corp. (SMTC) 28 STMicroelectronics (STM) 29 Taiwan Semic. ADR (TSM) 30 Tessera Technologies (TSRA) 31 Texas Instruments (TN) 32 TriQuint Semic. (TQNT) 33 Xilinx Inc. (XLN) 34 35 36 37 38 39 40 41 42 43 44 1 4 3 3 5 4 3 3 4 3 5 3 4 4 3 3 3 NMF 3 5 NMF 4 3 4 4 3 2 W WN Step-l: Open hw13 Data Set 37th Ed.xlsx. This is some current raw industry data from Value Line. Value Line is a provider of financial information and is very useful if you want to obtain information about publicly held companies. Value Line provides brief overviews of industries, and then provides detailed information about companies within industries. Please note that the data in the data set does not include the column headings for the data that was shown on Value Line's website. You will need to add these headings to your Excel worksheet. In row 1, insert headings as shown below, being certain to not lose any data: 1 B Price per sharel D Market Cap Timeliness ($M) Rankl E Safety Rankl F Technical Rank Company Name (Ticker) Format the data with the new headings to make it useful and easy to read. You should now have a table of Semiconductor Companies data in Excel. QI: How many companies (data rows) are represented in this industry peer data? Step-2: Suppose you are evaluating the Semiconductor Companies. For example, you want to compare a company's performance against industry norms. You will need some summary statistics that provide a quick picture of the industry. To generate statistics using Excel, first empty all cells containing NMF (which stands for "Not Meaningful"), because Excel will not handle this non-numeric text. You can simply use the "Find and Replace functionality by pressing Ctrl+H, entering NMF in the "Find what box, leaving the "Replace with" text box blank, and then clicking the Replace All button in the lower center area of the dialog box. HW13-1 Now go to the Data ribbon, click on Data Analysis and select Descriptive Statistics. If you do not see the Data Analysis option, then you need to activate this option by adding in the Excel Data Analysis Add-In. In the Descriptive Statistics dialog box, click inside the "Input Range:"textbox, and enter the entire range of data in column B, including the header row. Variables are sorted by column, so the Columns radio button should be selected. Because you have included the header row.check the Labels in First Row checkbox. In the Output options section of the dialog box, click the "Output Range:" radio button, and enter a reference to a cell several rows to the right of the data. Make sure that the "Summary statistics" checkbox is checked, and then click the OK button located toward the upper right of the dialog box. Be sure to adjust the column width of the new information so that the headings align correctly and the information is understandable. Q2: What is the mean price among the stocks analyzed? Step-3: Generate Descriptive statistics again, this time for the data in columns C-F. You can do this one column at a time, or put all of the columns in the Input Range (C1:F34) Q3: What are the mean and median timeliness ratings among the stocks? What are the mean and median capitalization amounts among the stocks? Step-4: Delete any descriptive statistics you created. Enter the following in the indicated cells I Frequency K Valid Percent Percent 1 2 3 4 H Timeliness Rank 1 2 3 4 5 TOTAL 5 6 7 In 12, we want to count the number of occurrences of a Timeliness Rank of 1, so enter -COUNTIF($D$2:$D$34,H2) in 12. Copy this formula to 13:16 and enter a formula in 17 to total all of the counts. In J2, we want to determine what % of all the data the frequencies represent, so enter =12/33 in J2. Copy this formula to 13:36 and enter a formula in 37 to total all of the percents. Format J2:37 as percents with two decimal places. In K2, we want to determine what % of all the data rows the frequencies represent but only for companies that have a timeliness rank, so enter =12/$1$7 in K2. Copy this formula to K3 K6 and enter a formula in K7 to total all of the percents. Format K2:K7 as percents with two decimal places. 04: How many stocks have a timeliness rank of 4? Report the absolute number (Frequency). the percent among all companies included in the data (Percent), and the percent among companies that have timeliness rankings in the data (Valid Percent). Now some general discussion and a final question With respect to Value Line, Value Line is available online and also in printed form at our university library. Value Line is one of several tools that is quite useful if you want to evaluate company performance, either compared to industry peers as in this assignment, or simply over time, for example to see how or whether the company's use of assets has improved over time. This information can be quite helpful when you recruit with companies because it can provide you with some "big-picture" data. Regarding means and frequencies, many business questions can be addressed simply by evaluating means and frequencies. For example, when evaluating the productivity of an assembly line, what is the frequency of product defects, and is this frequency greater in certain production areas? Similarly, from an accounting stance, what is the frequency of bad debts? Or from an MIS or marketing stance, how many customers want different types of MIS products? And from HR, how many employees love their job versus hate their job, what is the mean job-satisfaction level, and has this level changed over time? Going back to the data, one task commonly performed is to sort data. Sorting data is very easy to accomplish in Excel. Select all the cells in the range Al:F34 and then click on sort in the Data Ribbon. In the Sort by dropdown select Price Per Share and in the Order Dropdown select Largest to Smallest. Then Click OK. Note the company with the highest stock price, and then sort again, this time on safety rating. 05: What is the ticker symbol for the stock(s) with the highest price, and what is the ticker symbol for the stock(s) with the lowest (worst) safety rating? (You may need to change the number of visible decimals for stock price to answer this question.) Just report this information in a sentence or two. ats | M tamilstaarnamalar - alar - to -lay tart verb Dia OH - Clipboard fia 017 F G E D 3 NMF 2 2 3 4 4 3 5 3 4 5 4 5 3 4 3 2 NMF 3 2 4 5 4 B 22.47 14.19 23.21 14.09 38.6 2.44 5.7 8.55 8.48 1.42 28.82 24.18 5.9 37.42 15.56 24.6 32.52 5.56 7.85 33.85 37.64 12.8 28.62 7.98 17.14 18.05 17.79 19.58 11.39 41.71 38.12 5.14 27.23 4 NMF 4 NMF 3 5 4 3 3 NMF 2 1 NMF 4 4 3 3 5 4 4 3 1012.004 7804.5 8264.477 829.098 12625.98 687.655 2786.388 166.443 747.622 696.301 2209.197 3691.682 298.811 2713.474 3052.53 142212.6 4337.972 638.027 3177.39 10855.36 8184.404 9674.239 8972.37 1697.051 2663.847 1850.215 1293.315 17571.51 58761.01 1987.064 54652.99 714.748 9036.657 11. Advanced Energy (AEIS) 2 Advanced Micro Dev. (AMD) 3. Altera Corp. (ALTR) 4 ANADIGICS Inc. (ANAD) 5 Analog Devices (ADI) 6 Applied Micro (AMCC) 7 Atmel Corp. (ATML) 8 CEVA, Inc. (CEVA) 9 Cirrus Logic (CRUS) 10 Conexant Systems (CNXT) 11 Cree, Inc. (CREE) 12 Cypress Semic (CY) 13 EMCORE Corp. (EMKR) 14 Int'l Rectifier (IRF) 15 Integrated Device (IDTI) 16 Intel Corp. (INTC) 17 Intersil Corp. 'A' (ISIL) 18 Lattice Semiconductor (LSCC) 19 LSI Corp. (LSI) 20 Maxim Integrated (MXIM) 21 Microchip Technology (MCHP) 22 Micron Technology (MU) 23 National Semic (NSM) 24 PMC Sierra (PMCS) 25 QLogic Corp. (QLGC) 26 Rambus Inc. (RMBS) 27 Semtech Corp. (SMTC) 28 STMicroelectronics (STM) 29 Taiwan Semic. ADR (TSM) 30 Tessera Technologies (TSRA) 31 Texas Instruments (TN) 32 TriQuint Semic. (TQNT) 33 Xilinx Inc. (XLN) 34 35 36 37 38 39 40 41 42 43 44 1 4 3 3 5 4 3 3 4 3 5 3 4 4 3 3 3 NMF 3 5 NMF 4 3 4 4 3 2 W WN Step-l: Open hw13 Data Set 37th Ed.xlsx. This is some current raw industry data from Value Line. Value Line is a provider of financial information and is very useful if you want to obtain information about publicly held companies. Value Line provides brief overviews of industries, and then provides detailed information about companies within industries. Please note that the data in the data set does not include the column headings for the data that was shown on Value Line's website. You will need to add these headings to your Excel worksheet. In row 1, insert headings as shown below, being certain to not lose any data: 1 B Price per sharel D Market Cap Timeliness ($M) Rankl E Safety Rankl F Technical Rank Company Name (Ticker) Format the data with the new headings to make it useful and easy to read. You should now have a table of Semiconductor Companies data in Excel. QI: How many companies (data rows) are represented in this industry peer data? Step-2: Suppose you are evaluating the Semiconductor Companies. For example, you want to compare a company's performance against industry norms. You will need some summary statistics that provide a quick picture of the industry. To generate statistics using Excel, first empty all cells containing NMF (which stands for "Not Meaningful"), because Excel will not handle this non-numeric text. You can simply use the "Find and Replace functionality by pressing Ctrl+H, entering NMF in the "Find what box, leaving the "Replace with" text box blank, and then clicking the Replace All button in the lower center area of the dialog box. HW13-1 Now go to the Data ribbon, click on Data Analysis and select Descriptive Statistics. If you do not see the Data Analysis option, then you need to activate this option by adding in the Excel Data Analysis Add-In. In the Descriptive Statistics dialog box, click inside the "Input Range:"textbox, and enter the entire range of data in column B, including the header row. Variables are sorted by column, so the Columns radio button should be selected. Because you have included the header row.check the Labels in First Row checkbox. In the Output options section of the dialog box, click the "Output Range:" radio button, and enter a reference to a cell several rows to the right of the data. Make sure that the "Summary statistics" checkbox is checked, and then click the OK button located toward the upper right of the dialog box. Be sure to adjust the column width of the new information so that the headings align correctly and the information is understandable. Q2: What is the mean price among the stocks analyzed? Step-3: Generate Descriptive statistics again, this time for the data in columns C-F. You can do this one column at a time, or put all of the columns in the Input Range (C1:F34) Q3: What are the mean and median timeliness ratings among the stocks? What are the mean and median capitalization amounts among the stocks? Step-4: Delete any descriptive statistics you created. Enter the following in the indicated cells I Frequency K Valid Percent Percent 1 2 3 4 H Timeliness Rank 1 2 3 4 5 TOTAL 5 6 7 In 12, we want to count the number of occurrences of a Timeliness Rank of 1, so enter -COUNTIF($D$2:$D$34,H2) in 12. Copy this formula to 13:16 and enter a formula in 17 to total all of the counts. In J2, we want to determine what % of all the data the frequencies represent, so enter =12/33 in J2. Copy this formula to 13:36 and enter a formula in 37 to total all of the percents. Format J2:37 as percents with two decimal places. In K2, we want to determine what % of all the data rows the frequencies represent but only for companies that have a timeliness rank, so enter =12/$1$7 in K2. Copy this formula to K3 K6 and enter a formula in K7 to total all of the percents. Format K2:K7 as percents with two decimal places. 04: How many stocks have a timeliness rank of 4? Report the absolute number (Frequency). the percent among all companies included in the data (Percent), and the percent among companies that have timeliness rankings in the data (Valid Percent). Now some general discussion and a final question With respect to Value Line, Value Line is available online and also in printed form at our university library. Value Line is one of several tools that is quite useful if you want to evaluate company performance, either compared to industry peers as in this assignment, or simply over time, for example to see how or whether the company's use of assets has improved over time. This information can be quite helpful when you recruit with companies because it can provide you with some "big-picture" data. Regarding means and frequencies, many business questions can be addressed simply by evaluating means and frequencies. For example, when evaluating the productivity of an assembly line, what is the frequency of product defects, and is this frequency greater in certain production areas? Similarly, from an accounting stance, what is the frequency of bad debts? Or from an MIS or marketing stance, how many customers want different types of MIS products? And from HR, how many employees love their job versus hate their job, what is the mean job-satisfaction level, and has this level changed over time? Going back to the data, one task commonly performed is to sort data. Sorting data is very easy to accomplish in Excel. Select all the cells in the range Al:F34 and then click on sort in the Data Ribbon. In the Sort by dropdown select Price Per Share and in the Order Dropdown select Largest to Smallest. Then Click OK. Note the company with the highest stock price, and then sort again, this time on safety rating. 05: What is the ticker symbol for the stock(s) with the highest price, and what is the ticker symbol for the stock(s) with the lowest (worst) safety rating? (You may need to change the number of visible decimals for stock price to answer this question.) Just report this information in a sentence or two
