Attached below are the financial records of company A and company B. Compare statements of year 2019 for both companies and calculate the "Accounts receivable turnover, Days' sales in receivables, Debt Ratio, Debt to equity ratio, times-interest-earned ratio " for each company for the year 2019 and compare the results for both companies and provide a short conclusion for each comparison. 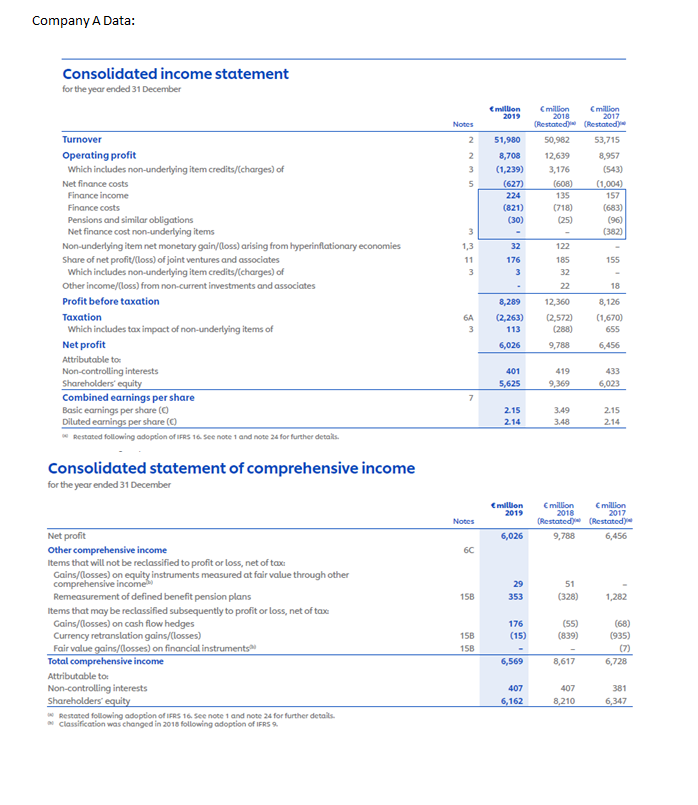
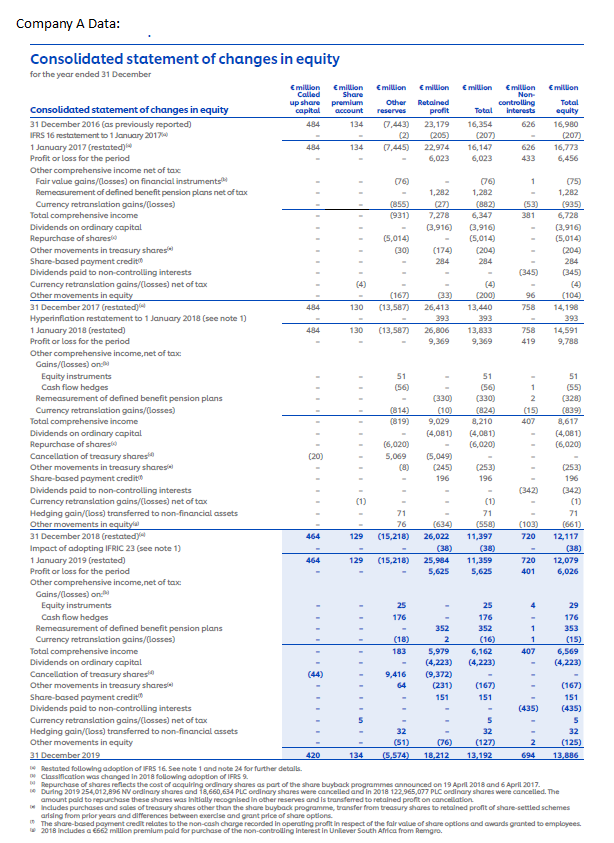
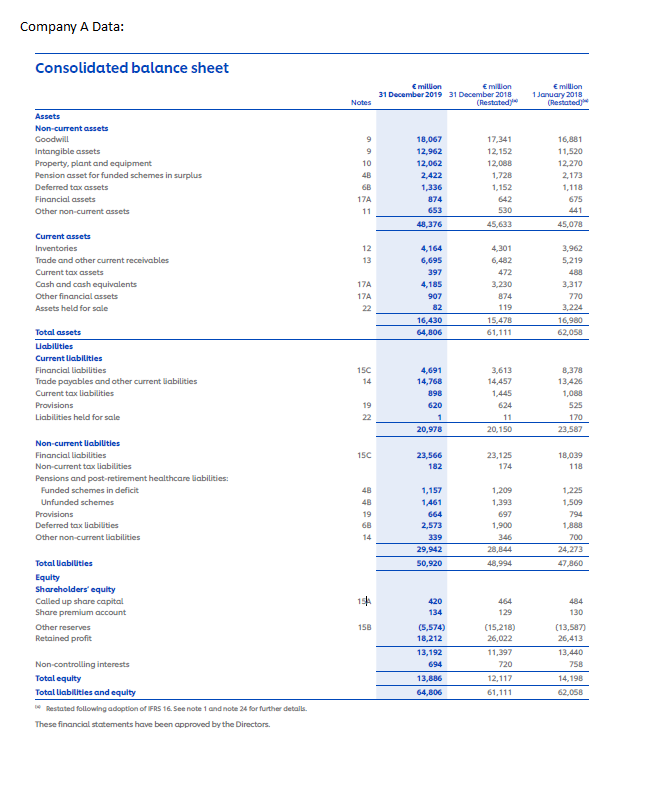
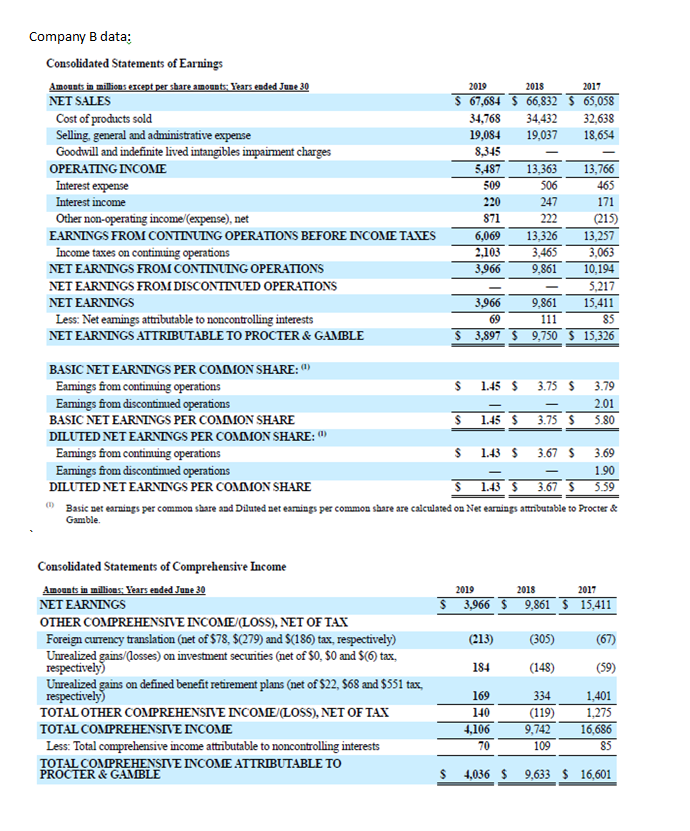
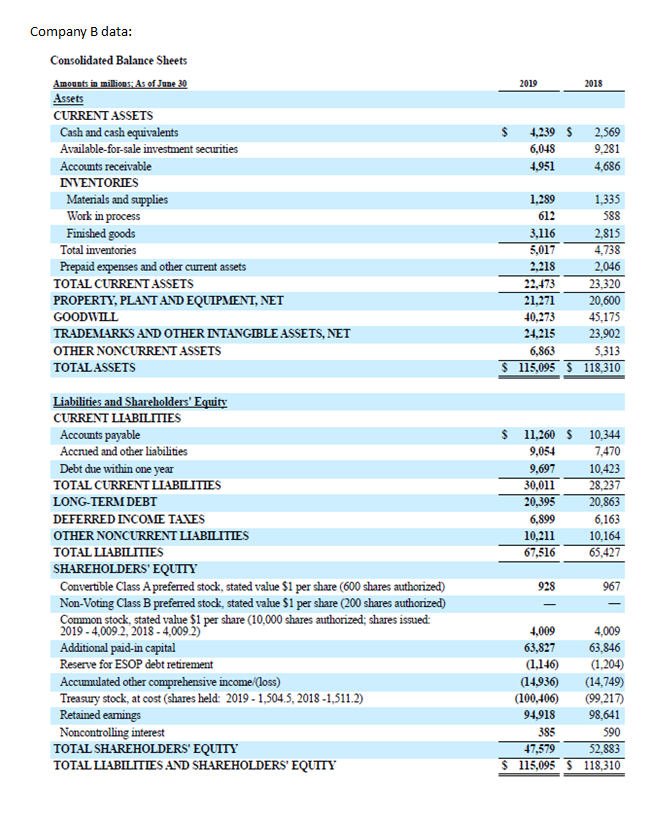
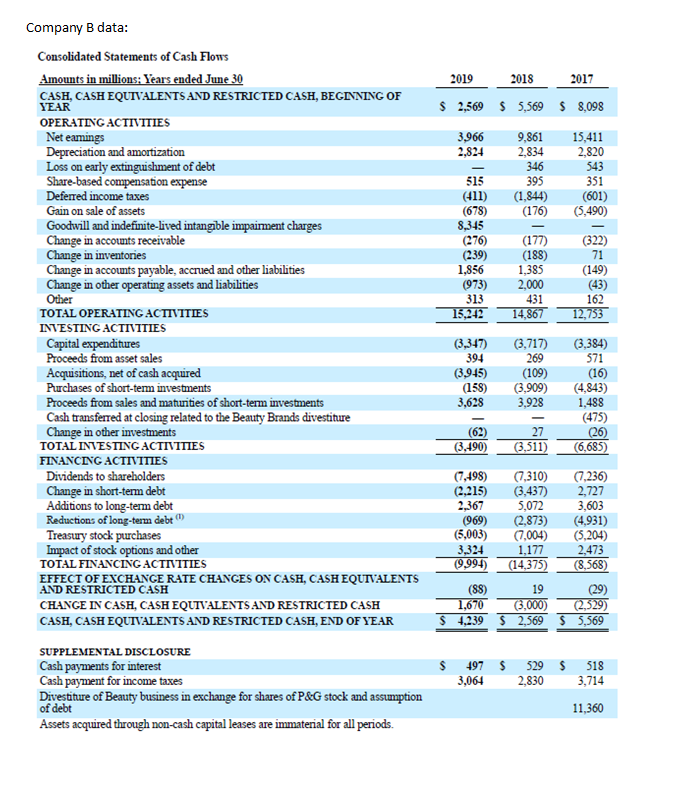
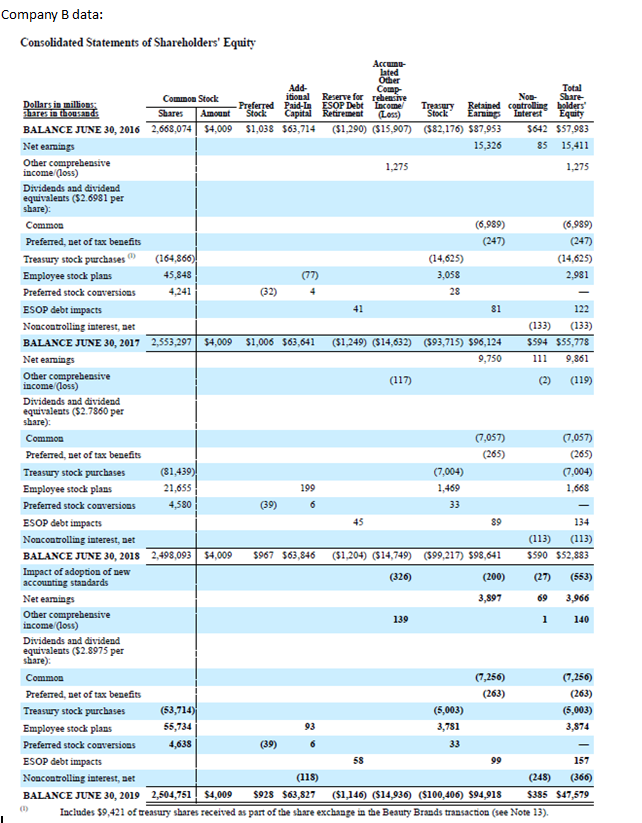
Company A Data: Consolidated income statement for the year ended 31 December million 2019 Notes 2 2 3 5 51,980 8,708 (1,239) (627) 224 (821) (30) million million 2018 2017 (Restated (Restated 50,982 53,715 12,639 8,957 3,176 (543) (608) (1,004) 135 157 (718) (683) (25) (96) (382) 3 122 1,3 11 3 32 176 3 155 185 32 Turnover Operating profit Which includes non-underlying item credits/(charges) of Net finance costs Finance income Finance costs Pensions and similar obligations Net finance cost non-underlying items Non-underlying item net monetary gain/loss) arising from hyperinflationary economies Share of net profit/(loss) of joint ventures and associates Which includes non-underlying item credits/(charges) of Other income/(Loss) from non-current investments and associates Profit before taxation Taxation Which includes tax impact of non-underlying items of Net profit Attributable to: Non-controlling interests Shareholders' equity Combined earnings per share Basic earnings per share ( Diluted earnings per share (0) Restated following adoption of IFRS 16 See note 1 and note 24 for further details. 18 6A 3 8,289 (2,263) 113 22 12,360 (2,572) (288) 9,788 8.126 (1,670) 655 6,456 6,026 401 5,625 419 9,369 433 6,023 7 2.15 2.14 3.49 3.48 2.15 2.14 Consolidated statement of comprehensive income for the year ended 31 December million 2019 2017 Notes Emillion million 2018 Restated (Restated) 9,788 6,456 6,026 6C 51 29 353 15B (328) 1,282 176 Net profit Other comprehensive income items that will not be reclassified to profit or loss, net of tox Gains/losses) on equity instruments measured at fair value through other comprehensive income Remeasurement of defined benefit pension plans Items that may be reclassified subsequently to profit or loss, net of tax Gains/(losses) on cash flow hedges Currency retranslation gains (losses) Fair value gains/Llosses) on financial instruments Total comprehensive income Attributable to: Non-controlling interests Shareholders' equity Restated following adoption of IFRS 16 See note 1 and note 24 for further details Classification was changed in 2016 following adoption of IFRS 9. (55) (839) (15) 15B 15B (68) (935) (7) 6,728 6,569 8,617 407 6,162 407 8,210 381 6,347 Company A Data: Consolidated statement of changes in equity 393 484 1 (10) (159 for the year ended 31 December Emillion Emillion Emillion million million million million Called Share Non up share premium Other Retained controlling Total Consolidated statement of changes in equity capital account reserves profit Total interests equity 31 December 2016 (as previously reported) 134 (7.443) 23,179 16,354 16,980 IFRS 16 restatement to 1 January 2017 (2) C205) (207) (207) 1 January 2017 (restated) 484 134 (7,445) 22,974 16,147 626 16,773 Profit or loss for the period 6,023 6,023 433 6,456 Other comprehensive income net of tax Fair value gains/Closses) on financial instruments 076 (76) 1 (75) Remeasurement of defined benefit pension plans net of tax 1,282 1,282 1,282 Currency retranslation gains/Closses) (855) (27) (882) (53) (935 Total comprehensive income (931) 7,278 6,347 381 6,728 Dividends on ordinary capital (3.916) (3,916) (3,916) Repurchase of sharest (5,014) (5,014) (5,014 Other movements in treasury shares (174) (204) (204) Share-based payment credito 284 284 284 Dividends paid to non-controlling interests (345) (345) Currency retranslation gains/(losses) net of tax (4) Other movements in equity (167) (33) (200) 96 (104) 31 December 2017 (restated) 484 130 (13,587) 26,413 13,440 758 14,190 Hyperinflation restatement to 1 January 2018 (see note 1) 393 1 January 2018 (restated) 130 (13,587) 26,806 13,833 758 14,591 Profit or loss for the period 9,369 9,369 419 9,788 Other comprehensive income, net of tax Gains/losses) on Equity instruments 51 51 51 Cash flow hedges (56) (56) (55) Remeasurement of defined benefit pension plans (330) (330) 2 (328) Currency retranslation gains/Closses) (814) (824 (839) Total comprehensive income (819) 9,029 8,210 407 8,617 Dividends on ordinary capital (4,081) (4,081) (4,081) Repurchase of sharest (6,020) (6,020) (6,020) Cancellation of treasury shareste (20) 5,069 (5,049) Other movements in treasury shares (8) (245) (253) (253) Share-based payment credito 196 196 196 Dividends paid to non-controlling interests (342) (342) Currency retranslation gains/(losses) net of tax (1) (1) Hedging gain/loss) transferred to non-financial assets 71 71 71 Other movements in equity 76 (634 (558) (103) (661) 31 December 2018 (restated) 464 129 (15,218) 26,022 11,397 720 12,117 Impact of adopting IFRIC 23 (see note 1) (38) (38) 1 January 2019 (restated) 464 129 (15,218) 25,984 11,359 720 12,079 Profit or loss for the period 5,625 5,625 401 6,026 Other comprehensive income, net of tax Gains/losses) on: Equity instruments 25 25 4 29 Cash flow hedges 176 176 176 Remeasurement of defined benefit pension plans 352 352 1 353 Currency retranslation gains/Closses) 2 (16) 1 (15) Total comprehensive income 183 5,979 6,162 407 6,569 Dividends on ordinary capital (4,223) (4,223) (4,223) Cancellation of treasury shares 9,416 (9,372) Other movements in treasury shares 64 (231) (167) (167) Share-based payment credito 151 151 Dividends paid to non-controlling interests (435) (435) Currency retranslation gains/Classes) net of tax 5 5 5 Hedging gain/Closs) transferred to non-financial assets 32 32 32 Other movements in equity (76) (127) 2 (125) 31 December 2019 420 134 (5,574) 18,212 13,192 694 13,886 De Restated following adoption of IFRS 16. See note 1 and note 24 for further details. Classification was changed in 2018 folowing adoption of IFRS 9. Repurchase of shares reflects the cost of acquiring ordinary shares as part of the share buyback programmes announced on 19 April 2018 and 6 April 2017 During 2019 254,012,896 NV ordinary shares and 18,660,634 PLC ordinary shares were cancelled and in 2018 122.965,077 PLC ordinary shares were cancelled. The amount paid to repurchase these shares was initially recognised in other reserves and is transferred to retained profit on cancellation Includes purchases and sales of treasury shares other than the share buyback programme, transfer from treasury shares to retained profit of share-settled schemes arising from prior years and differences between exercise and grant price of share options. The share-based payment credit relates to the non-cash charge recorded in operating profit in respect of the fair value of share options and awards granted to employees 2018 Includes a 662 million premium palid for purchase of the non-controlling Interest in Unilever South Africa from Remgro. (16 151 (51) Company A Data: Consolidated balance sheet E million million 31 December 2019 31 December 2018 (Restated E million 1 January 2018 (Restated Notes Assets Non-current assets Goodwill Intangible assets Property, plant and equipment Pension asset for funded schemes in surplus Deferred tax assets Financial assets Other non-current assets 9 9 10 45 6B 17A 11 18,067 12,962 12.062 2,422 1,336 874 653 48,376 17,341 12,152 12.088 1,728 1,152 642 530 45,633 16,881 11,520 12,270 2,173 1,118 675 441 45,078 12 13 Current assets Inventories Trade and other current receivables Current tax assets Cash and cash equivalents Other financial assets Assets held for sale 17A 17A 22 4,164 6,695 397 4,185 907 82 16,430 64,806 4,301 6,482 472 3.230 874 119 15,478 61.111 3,962 5,219 488 3,317 770 3.224 16,980 62,058 Total assets Liabilities Current liabilities Financial liabilities Trade payables and other current liabilities Current tax liabilities Provisions Liabilities held for sale 150 14 4,691 14,768 898 620 1 20,978 3,613 14,457 1,445 624 11 20,150 8,378 13,426 1,088 525 170 23,587 19 22 150 23,566 182 23,125 174 18,039 118 Non-current abilities Financial liabilities Non-current tax liabilities Pensions and post-retirement healthcare liabilities: Funded schemes in deficit Unfunded schemes Provisions Deferred tax liabilities Other non-current liabilities 4B 48 19 1,157 1.461 664 2,573 339 29,942 50,920 1,209 1,393 697 1,900 1.225 1,509 794 1,888 700 24,273 47,860 28,844 48,994 Total labiuties Equity Shareholders' equity Called up share capital Share premium account Other reserves Retained profit 15 464 420 134 129 404 130 158 Non-controlling interests Total equity Total liabilities and equity Restated following adoption of IFRS 16. See note 1 and note 24 for further details. These financial statements have been approved by the Directors. (5,574) 18,212 13,192 694 13,836 64,806 (15,218) 26,022 11,397 720 12,117 61,111 (13,587) 26,413 13,440 758 14,198 62,058 Company B data: Consolidated Statements of Earnings Amounts in millions except per share amounts: Years eaded June 30 NET SALES Cost of products sold Selling general and administrative expense Goodwill and indefinite lived intangibles impairment charges OPERATING INCOME Interest expense Interest income Other non-operating income (expense), net EARNINGS FROM CONTINUING OPERATIONS BEFORE INCOME TAXES Income taxes on contimung operations NET EARNINGS FROM CONTINUING OPERATIONS NET EARNINGS FROM DISCONTINUED OPERATIONS NET EARNINGS Less: Net eamings attributable to noncontrolling interests NET EARNINGS ATTRIBUTABLE TO PROCTER & GAMBLE 2019 2018 2017 $ 67,684 $ 66,832 $ 65,058 34,768 34,432 32,638 19,084 19,037 18,654 8,345 5,487 13,363 13,766 509 506 465 220 247 171 871 222 (215) 6,069 13.326 13,257 2,103 3,465 3,063 3,966 9.861 10.194 5,217 3,966 9,861 15,411 69 111 85 $ 3,897 $ 9,750 S 15,326 $ BASIC NET EARNINGS PER COMMON SHARE:) Eamings from contimung operations $ 1.45 $ 3.75 $ 3.79 Eamings from discontimed operations 2.01 BASIC NET EARNINGS PER COMMON SHARE 1.45 $ 3.75 $ 5.80 DILUTED NET EARNINGS PER COMMON SHARE:) Eamings from continuing operations $ 1.43 $ 3.67 $ 3.69 Earnings from discontimed operations 1.90 DILUTED NET EARNINGS PER COMMON SHARE $ 1.435 3.67 5 5.59 Basic Det earnings per common share and Diluted net earnings per common share are calculated on Net earnings attributable to Procter & Gamble 2019 2018 2017 3,966 $ 9,861 $ 15,411 (213) (305) (67) Consolidated Statements of Comprehensive Income Amounts in millions; Years ended June 30 NET EARNINGS OTHER COMPREHENSIVE INCOME/(LOSS), NET OF TAX Foreign currency translation (net of $78, $(279) and S(186) tax, respectively) Unrealized gains/(losses) on investment securities (net of $0.50 and $(6) tax, respectively) Unrealized gains on defined benefit retirement plans (net of $22, 568 and $551 tax, respectively) TOTAL OTHER COMPREHENSIVE INCOME/(LOSS), NET OF TAX TOTAL COMPREHENSIVE INCOME Less: Total comprehensive income attributable to noncontrolling interests TOTAL COMPREHENSIVE INCOME ATTRIBUTABLE TO PROCTER & GAMBLE 184 (148) (59) 169 140 4,106 70 334 (119) 9,742 109 1,401 1,275 16,686 85 $ 4,036 $ 9,633 $ 16,601 2019 2018 $ 4,239 $ 6,048 4,951 2,569 9.281 4,686 Company B data: Consolidated Balance Sheets Amounts in millions; As of June 30 Assets CURRENT ASSETS Cash and cash equivalents Available-for-sale investment securities Accounts receivable INVENTORIES Materials and supplies Work in process Finished goods Total inventories Prepaid expenses and other curent assets TOTAL CURRENT ASSETS PROPERTY, PLANT AND EQUIPMENT, NET GOODWILL TRADEMARKS AND OTHER INTANGIBLE ASSETS, NET OTHER NONCURRENT ASSETS TOTAL ASSETS 1,289 1,335 612 588 3,116 2,815 5,017 4,738 2,218 2,046 22,473 23,320 21,271 20,600 40,273 45,175 24,215 23,902 5,313 $ 115,095 $ 118,310 6,863 9,697 $ 11,260 $ 10,344 9,054 7,470 10,423 30.011 28,237 20,395 20,863 6,899 6,163 10,211 10,164 67,516 65,427 Liabilities and Shareholders' Equity CURRENT LIABILITIES Accounts payable Accrued and other liabilities Debt due within one year TOTAL CURRENT LIABILITIES LONG-TERM DEBT DEFERRED INCOME TAXES OTHER NONCURRENT LIABILITIES TOTAL LIABILITIES SHAREHOLDERS' EQUITY Convertible Class A preferred stock, stated value $1 per share (600 shares authorized) Non-Voting Class B preferred stock, stated value $1 per share (200 shares authorized) Common stock, stated value $1 per share (10,000 shares authorized; shares issued 2019 - 4,009.2, 2018 - 4,009.2) Additional paid-in capital Reserve for ESOP debt retirement Accumulated other comprehensive income (loss) Treasuwy stock, at cost (shares held: 2019 - 1,504.5, 2018 -1,511.2) Retained earnings Noncontrolling interest TOTAL SHAREHOLDERS' EQUITY TOTAL LIABILITIES AND SHAREHOLDERS' EQUITY 928 967 4,009 4,009 63,827 63,846 (1,146) (1,204) (14936) (14,749) (100,406) (99,217) 94,918 98,641 385 590 47,579 52,883 $ 115,095 $ 118,310 Company B data: 2,820 2019 2018 2017 $ 2,569 $ 5,569 $ 8,098 3,966 9,861 15,411 2,824 2,834 346 543 515 395 351 (411) (1,844) (601) (678) (176) (5,490) 8,345 (276) (177) (322) (239) (188) 71 1,856 1,385 (149) (973) 2,000 (43) 313 431 162 15,242 14,867 12,753 (3,717) 269 Consolidated Statements of Cash Flows Amounts in millions: Years ended June 30 CASH, CASH EQUIVALENTS AND RESTRICTED CASH, BEGINNING OF YEAR OPERATING ACTIVITIES Net eamings Depreciation and amortization Loss on early extinguishment of debt Share-based compensation expense Deferred income taxes Gain on sale of assets Goodwill and indefinite-lived intangible impairment charges Change in accounts receivable Change in inventories Change in accounts payable, accrued and other liabilities Change in other operating assets and liabilities Other TOTAL OPERATING ACTIVITIES INVESTING ACTIVITIES Capital expenditures Proceeds from asset sales Acquisitions, net of cash acquired Purchases of short-term investments Proceeds from sales and maturities of short-term investments Cash transferred at closing related to the Beauty Brands divestiture Change in other investments TOTAL INVESTING ACTIVITIES FINANCING ACTIVITIES Dividends to shareholders Change in short-term debt Additions to long-term debt Reductions of long-term debt") Treasury stock purchases Impact of stock options and other TOTAL FINANCING ACTIVITIES EFFECT OF EXCHANGE RATE CHANGES ON CASH, CASH EQUIVALENTS AND RESTRICTED CASH CHANGE IN CASH, CASH EQUIVALENTS AND RESTRICTED CASH CASH, CASH EQUIVALENTS AND RESTRICTED CASH, END OF YEAR SUPPLEMENTAL DISCLOSURE Cash payments for interest Cash payment for income taxes Divestiture of Beauty business in exchange for shares of P&G stock and assumption of debt Assets acquired through non-cash capital leases are immaterial for all periods. (3,347) 394 (3,945) (158) 3,628 (109) (3,909) 3,928 (3,384) 571 (16) (4.843) 1,488 (475) (26) (6,685) (62) (3.190) 27 (3,511) (7,498) (2,215) 2,367 (969) (5,003) 3,324 (9.994) (7,310) (3,437) 5,072 (2,873) (7,004) 1,177 (14,375) (7,236) 2,727 3,603 (4,931) (5,204) 2.473 (8,568) (29) (2,329) $ 5,569 (88) 1,670 $ 4,239 19 (3.000) $ 2,569 $ $ 497 $ 3,064 529 2,830 518 3,714 11,360 Comp Stock Company B data: Consolidated Statements of Shareholders' Equity Acco lated Add- Other Total Common Stock itional Reserve for rehensive Nos Share Dollars in millions Preferred Paid-LO ESOP Debt Income Retained controlling bolders' shares in thousands Shares Amount Stock Capital Retirement (Loss) Interest Equity BALANCE JUNE 30, 2016 2,668,074 $4,009 $1,038 $63,714 (51,290) ($15,907) (582,176) $87,953 $642 $57.983 Net earings 15,326 85 15,411 Other comprebensive 1.275 income (loss) 1,275 Dividends and dividend equivalents (52.6981 per share): Common (6,989) (6,989) Preferred, net of tax benefits (247) (247) Treasury stock purchases (164,866) (14,625) (14,625) Employee stock plans 45,848 (77) 3,058 2,981 Preferred stock conversions 4,241 (32) 28 ESOP debt impacts 41 81 122 Noncontrolling interest, net (133) (133) BALANCE JUNE 30, 2017 2,553,297 54,009 $1,006 $63,641 ($1,249) ($14,632) (593,715) 596,124 $594 $55,778 Net earnings 9,750 111 9.861 Other comprehensive income (loss) (117) (2) (119) Dividends and dividend equivalents (52.7860 per share) Common (7,057) (7,057) Preferred, net of tax benefits (265) (265) Treasury stock purchases (81,439)! (7,004) (7,004) Employee stock plans 21,655 1,469 1,668 Preferred stock conversions 4,580 (39) 6 33 ESOP debt impacts 45 89 134 Noncontrolling interest, net (113) (113) BALANCE JUNE 30, 2018 2,498,093 54,009 $967 $63,846 ($1,204) ($14,749) (599,217) $98,641 $590 $52,883 Impact of adoption of new (320) (200) (27) (553) accounting standards Net earnings 3,897 69 3,966 Other comprehensive 139 1 140 income (loss) Dividends and dividend equivalents (52.8975 per share) Common (7,256) (7,256) Preferred, Det of tax benefits (263) (263) Treasury stock purchases (53,714) (5,003) (5,003) Employee stock plans 55,734 93 3,781 3,874 Preferred stock conversions 4,638 (39) 6 33 ESOP debt impacts 58 99 157 Noncontrolling interest, net (118) (248) (366) BALANCE JUNE 30, 2019 2,504,751 $4,009 $928 $63,827 ($1,146) ($14,936) ($100,406) $94,918 $385 $47,579 Includes $9,421 of treasury shares received as part of the share exchange in the Beauty Brands transaction (see Note 13). 199


