

Answered step by step
Verified Expert Solution
Question
1 Approved Answer
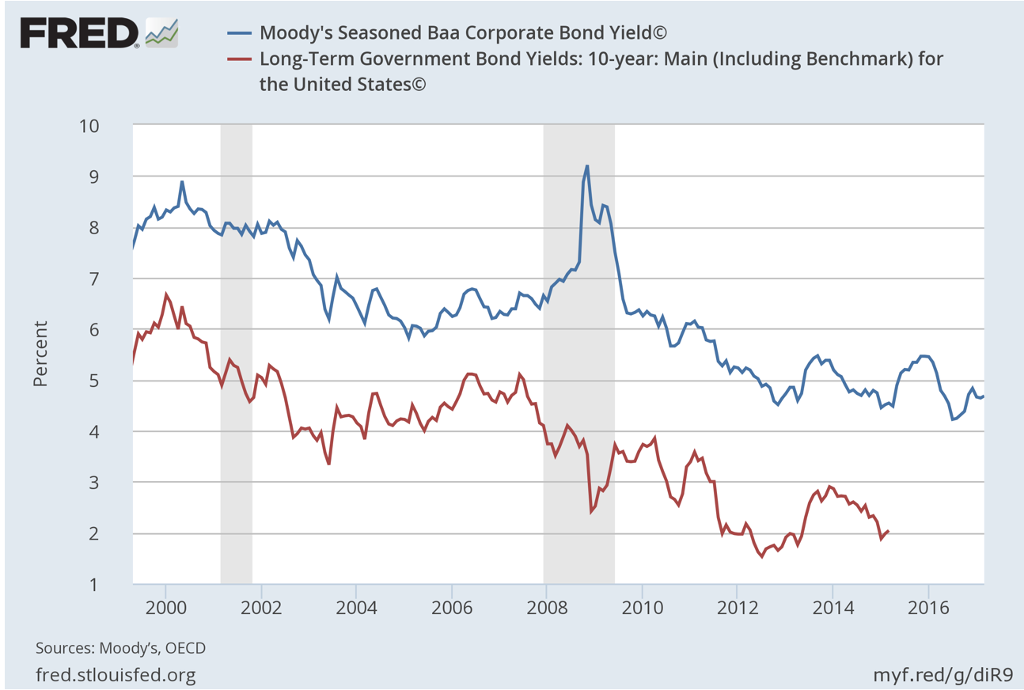
attached is a graph of corporate bond yield and t bill for usa from 2000 to current. i want various reasons for the fluctuation that
attached is a graph of corporate bond yield and t bill for usa from 2000 to current. i want various reasons for the fluctuation that happened .
regards
FRED 10 2000 Sources: Moody's, OECD fred stlouisfed.org Moody's Seasoned Baa Corporate Bond Yield@@ Long-Term Government Bond Yields: 10-year: Main (Including Benchmark) for the United StatesO 2004 2008 2014 2002 2006 2016 2010 2012 myf.red/g/diR9Step by Step Solution
There are 3 Steps involved in it
Step: 1

Get Instant Access to Expert-Tailored Solutions
See step-by-step solutions with expert insights and AI powered tools for academic success
Step: 2

Step: 3
Ace Your Homework with AI
Get the answers you need in no time with our AI-driven, step-by-step assistance
Get Started
The Money Markets Handbook A Practitioners Guide
Authors: Moorad Choudhry
1st Edition
0470821507, 978-0470821503