Answered step by step
Verified Expert Solution
Question
1 Approved Answer
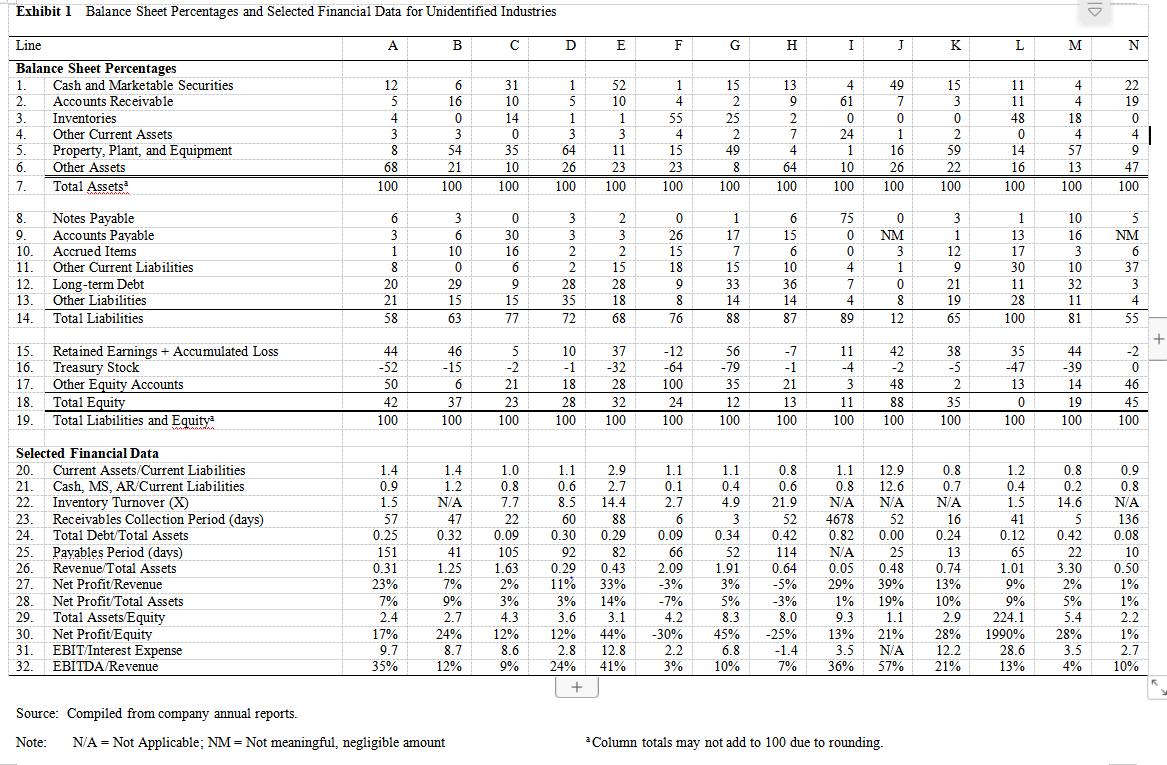
Attached is an Exhibit that presents the common size Balance Sheet and other selected financial data from 2017 / 2018 for fourteen fairly typical companies
- Attached is an Exhibit that presents the common size Balance Sheet and other selected financial data from 2017 / 2018 for fourteen fairly typical companies in fourteen different industries. Match the fourteen companies to the fourteen industries listed below.
- Aircraft manufacturer
- Airline
- Bookstore chain
- Commercial bank
- Computer software developer
- Department store chain
- Electric and gas utility
- IT hardware and storage provider
- Online retailer
- Parcel delivery service
- Pharmaceutical company
- Retail grocery chain
- Software and service provider for customer relationship management
- Social networking service
- Give a brief explanation of your reasoning for each. You may want to focus on the most unique industries first, or group similar industries such as services that likely would have little or no inventories. Feel free to use any approach you wish, and try to have fun with it. While your answer must be yours alone (or your group of two) for this question you may want to discuss/argue with other members of your class to get their points of view as well. Mostly I just want you to think about what typical industry ratios would likely be.

Exhibit 1 Balance Sheet Percentages and Selected Financial Data for Unidentified Industries Line A B E F G H I J K L M Balance Sheet Percentages 1. Cash and Marketable Securities 12 31 1 52 1 15 13 4 49 15 11 4 22 Accounts Receivable Inventories Other Current Assets 2. 5 16 10 10 4 9 61 7. 3 11 4 19 3. 4 14 1 1 55 25 48 18 4. 3 3 3 4 2 7 24 1 2 4 4 Property, Plant, and Equipment 6. 5. 8 54 35 64 11 15 49 4 16 59 14 57 6. Other Assets 68 21 10 26 23 23 8 64 10 26 22 16 13 47 7. Total Assets 100 100 100 100 100 100 100 100 100 100 100 100 100 100 8. Notes Payable 6. 3 3 1 6. 75 3 10 9. Accounts Payable 3 6. 30 3 3 26 17 15 NM 1 13 16 NM 10. Accrued Items 1 10 16 15 7. 6 3 12 17 3 11. Other Current Liabilities 8 15 18 15 10 4 6. 30 10 37 12. Long-term Debt 20 29 9 28 28 9 33 36 7 21 11 32 3 13. Other Liabilities 21 15 15 35 18 8. 14 14 4 19 28 11 4 14 Total Liabilities 58 63 77 72 68 76 88 87 89 12 65 100 81 55 Retained Earnings + Accumulated Loss Treasury Stock 17. 15. 44 46 5 10 37 -12 56 -7 11 42 38 35 44 -2 16. -52 -15 -2 -1 -32 -64 -79 -1 -4 -2 -5 -47 -39 6 Other Equity Accounts Total Equity 50 21 18 28 100 35 21 3 48 2 13 14 46 18. 42 37 23 28 32 24 12 13 11 88 35 19 45 19. Total Liabilities and Equity 100 100 100 100 100 100 100 100 100 100 100 100 100 100 Selected Financial Data 0.8 Current Assets/Current Liabilities Cash, MS. AR/Current Liabilities 20. 1.4 1.4 1.0 1.1 2.9 1.1 1.1 1.1 12.9 0.8 1.2 0.8 0.9 21. 0.9 1.2 0.8 0.6 2.7 0.1 0.4 0.6 0.8 12.6 0.7 0.4 0.2 0.8 Inventory Turnover (X) Receivables Collection Period (days) Total Debt/Total Assets 22. 1.5 N/A 7.7 8.5 14.4 2.7 4.9 21.9 N/A N/A N/A 1.5 14.6 N/A 23. 57 47 22 60 88 6 3 0 34 52 4678 0.82 52 16 41 136 24. 0.25 0.32 0.09 0.30 0.29 0.09 0.34 0.42 0.00 0.24 0.12 0.42 0.08 25. Payables Period (days) 151 41 105 92 82 66 52 114 N/A 25 13 65 22 10 26. Revenue/Total Assets Net Profit Revenue 1.91 30% 0.05 3.30 2% 0.31 1.25 1.63 0.29 0.43 2.09 0.64 0.48 0.74 1.01 0.50 27. 23% 7% 2% 11% 33% -3% -5% 29% 39% 13% 9% 1% 28. 29. Net Profit/Total Assets Total Assets/Equity Net Profit/Equity EBITInterest Expense EBITDA Revenue 7% 9% 3% 3% 14% -7% 5% -3% 1% 19% 10% 2.9 9% 5% 1% 2.4 2.7 4.3 3.6 3.1 4.2 8.3 8.0 9.3 1.1 224.1 5.4 2.2 45% 1990% 28.6 30. 17% 24% 12% 8.6 12% 44% -30% -25% 13% 21% 28% 28% 1% 3.5 8.7 12% 31. 9.7 2.8 12.8 2.2 6.8 -1.4 N/A 12.2 3.5 2.7 32. 35% 9% 24% 41% 3% 10% 7% 36% 57% 21% 13% 4% 10% Source: Compiled from company annual reports. Note: N/A = Not Applicable; NM = Not meaningful, negligible amount Column totals may not add to 100 due to rounding.
Step by Step Solution
★★★★★
3.46 Rating (159 Votes )
There are 3 Steps involved in it
Step: 1
iv Commercial bank J The first easily identificable industry would be a commercial bank because of the high volume of cash marketable securities Here ...
Get Instant Access to Expert-Tailored Solutions
See step-by-step solutions with expert insights and AI powered tools for academic success
Step: 2

Step: 3

Ace Your Homework with AI
Get the answers you need in no time with our AI-driven, step-by-step assistance
Get Started


