Answered step by step
Verified Expert Solution
Link Copied!

Question

1 Approved Answer

Attached is my work to this question, could someone please explain whether i have this correct, or if not, where ive gone wrong. also what

Attached is my work to this question, could someone please explain whether i have this correct, or if not, where ive gone wrong. also what else would need to be added to complete the question.

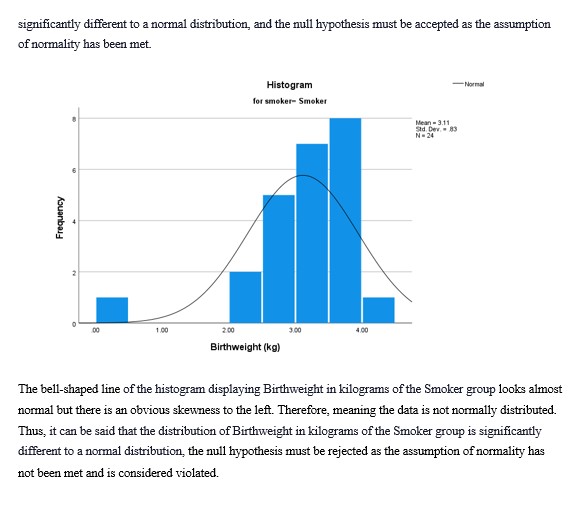
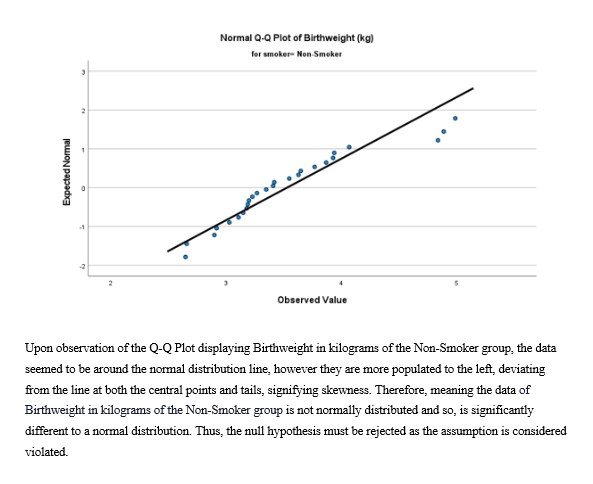
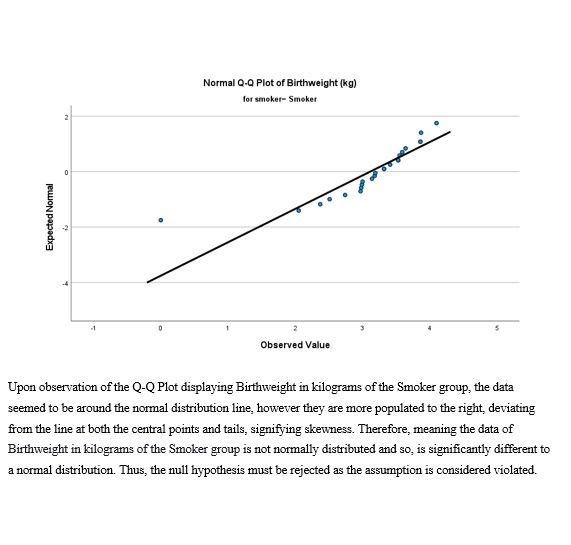
Comment on each table/graph as they relate to the assumptions that are being tested

(eg. describe if the image suggests the data is normally distributed and why) and then come to a conclusion about whether the assumption of homogeneity of variance and the assumption of normality have each been met or violated overall.

*each of these 2 assumptions are independent of the other. one can be violated when the other is not violated, vice versa.

Hint* answer should also refer to what the null hypothesis is for each of the numerical tests, whether this null hypothesis is accepted or rejected, and state the p value used to draw this conclusion.
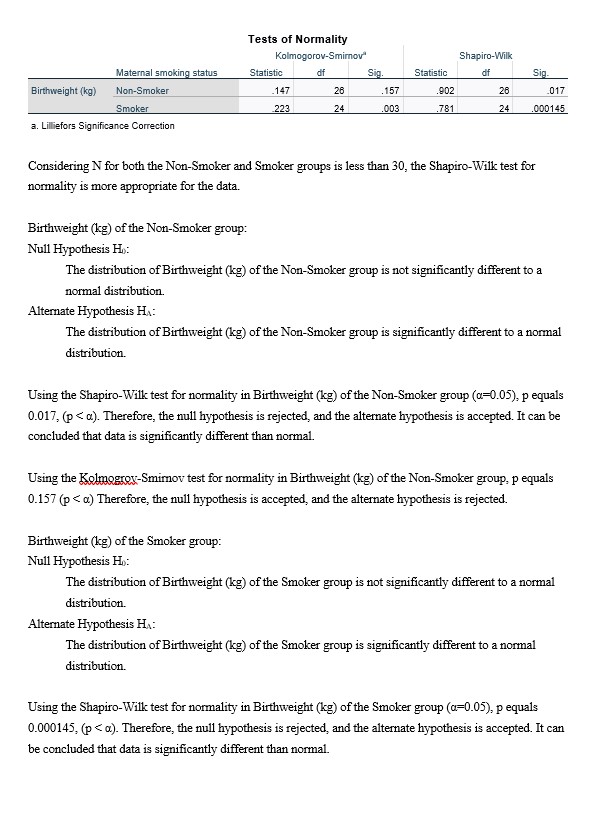
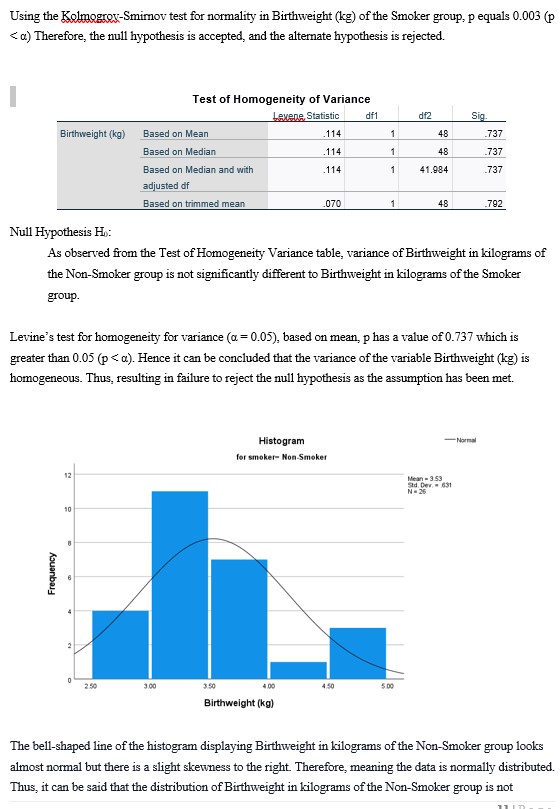
image text in transcribedimage text in transcribedimage text in transcribedimage text in transcribedimage text in transcribed
Tests of Normality Kolmogorov-Smimov" Shapiro-Wilk Maternal smoking status Statistic dif Sig Statistic dif Sig. Birthweight (kg) Non-Smoker 147 26 157 902 26 017 Smoker 223 24 003 781 24 000145 3. Lilliefors Significance Correction Considering N for both the Non-Smoker and Smoker groups is less than 30, the Shapiro-Wilk test for normality is more appropriate for the data. Birthweight (kg) of the Non-Smoker group: Null Hypothesis Ho: The distribution of Birthweight (kg) of the Non-Smoker group is not significantly different to a normal distribution. Alternate Hypothesis HA: The distribution of Birthweight (kg) of the Non-Smoker group is significantly different to a normal distribution. Using the Shapiro-Wilk test for normality in Birthweight (kg) of the Non-Smoker group (a=0.05), p equals 0.017, (p

Step by Step Solution

There are 3 Steps involved in it

Step: 1

blur-text-image

Get Instant Access to Expert-Tailored Solutions

See step-by-step solutions with expert insights and AI powered tools for academic success

Step: 2

blur-text-image

Step: 3

blur-text-image

Ace Your Homework with AI

Get the answers you need in no time with our AI-driven, step-by-step assistance

Get Started

Recommended Textbook for

Finite Math And Applied Calculus

Authors: Stefan Waner, Steven Costenoble

2nd Edition

0534366309, 9780534366308

More Books

Students also viewed these Mathematics questions

Question

When is it appropriate to use a root cause analysis

Answered: 1 week ago