Answered step by step
Verified Expert Solution
Question
1 Approved Answer
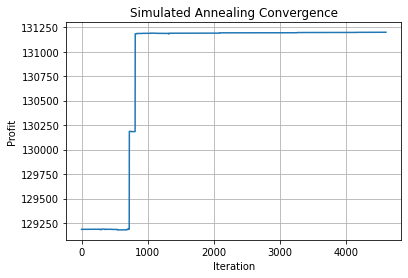
Attatched is the convergence graph of my Simulated Annealing algorithm. I currently make use of a geometric cooling scheme. Looking at the graph its clear
Attatched is the convergence graph of my Simulated Annealing algorithm. I currently make use of a geometric cooling scheme. Looking at the graph its clear to see it plateaus, I would please like some advice and recommendations on possible ways to improve my simulated annealing algorithm to ensure it is more consistently improving rather than plateauing.

Step by Step Solution
There are 3 Steps involved in it
Step: 1

Get Instant Access to Expert-Tailored Solutions
See step-by-step solutions with expert insights and AI powered tools for academic success
Step: 2

Step: 3

Ace Your Homework with AI
Get the answers you need in no time with our AI-driven, step-by-step assistance
Get Started


