Answered step by step
Verified Expert Solution
Link Copied!

Question

1 Approved Answer

Attention:Due to a bug in Google Chrome, this page may not function correctly. Click hare to lsarn mare 7. Using historical data to measure portfolio
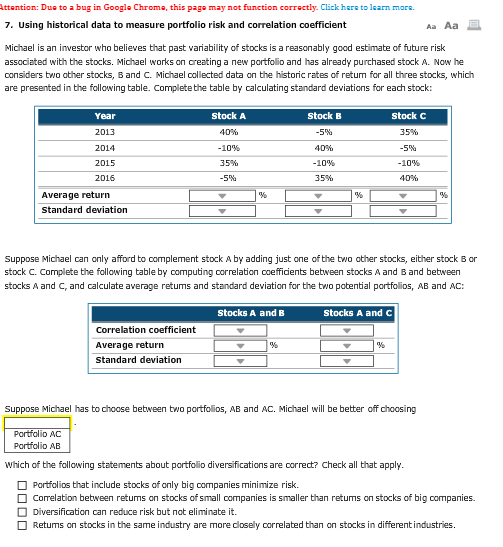
image text in transcribed

Attention:Due to a bug in Google Chrome, this page may not function correctly. Click hare to lsarn mare 7. Using historical data to measure portfolio risk and correlation coefficient Aa Aa Michael is an investor who believes that past variability of stocks is a reasonably good estimate of future risk associated with the stocks. Michael works on creating a new portfolio and has already purchased stock A. Now he considers two other stocks, B and C. Michael collected data on the historic rates of retum for all three stocks, which are presented in the following table. Competehe table by calculating standard deviations for each stock: Year 2013 2014 2015 2016 Stock A 40% 10% 35% 5% Stock B 5% 40% 10% 35% Stock C 35% 5% 10% 40% Average return Standard deviation Suppose Michael can only afford to complement stock A by adding just one of the two other stocks, either stock B on stock C. Complete the following table by computing correlation coefficients between stocks A and B and between stocks A and C, and calculate average retums and standard deviation for the two pabential portfolios, AB and AC: Stocks A and EB Stocks A and Correlation coefficient Average return Standard deviation Suppose Michael has to choose between two portfolios, AB and AC. Michael will be better off choosing Portfolio AC Portfolio AB which of the following statements about portfolio diversifications are correct? Check all that apply Portfolios that include stocks of anly big companies minimize risk. Correlation between retums on stocks of small companies is smaller than retums on stocks of big companies. Diversification can reduce risk but not eliminate it. Retums on stocks in the same industry are more closely correlated than on stocks in differentindustries

Step by Step Solution

There are 3 Steps involved in it

Step: 1

blur-text-image

Get Instant Access to Expert-Tailored Solutions

See step-by-step solutions with expert insights and AI powered tools for academic success

Step: 2

blur-text-image

Step: 3

blur-text-image

Ace Your Homework with AI

Get the answers you need in no time with our AI-driven, step-by-step assistance

Get Started

Recommended Textbook for

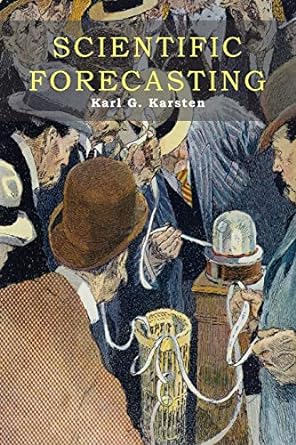
Scientific Forecasting

Authors: Karl Karsten

1st Edition

1614278148, 978-1614278146

More Books

Students also viewed these Finance questions

Question

What do they do well?

Answered: 1 week ago