Answered step by step
Verified Expert Solution
Link Copied!

Question

1 Approved Answer

Audit Trail - Statistics Accuracy Measures Value Forecast Statistics Value AIC 309.51 Durbin Watson (4) 1 . 01 BIC 313. 82 Mean 61.54 Mean Absolute
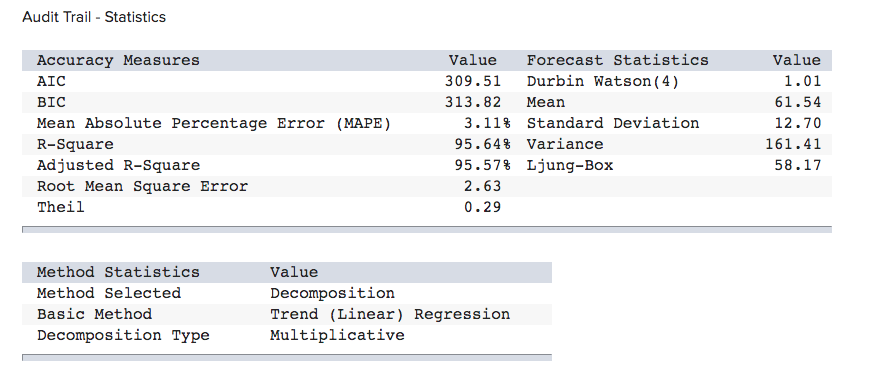
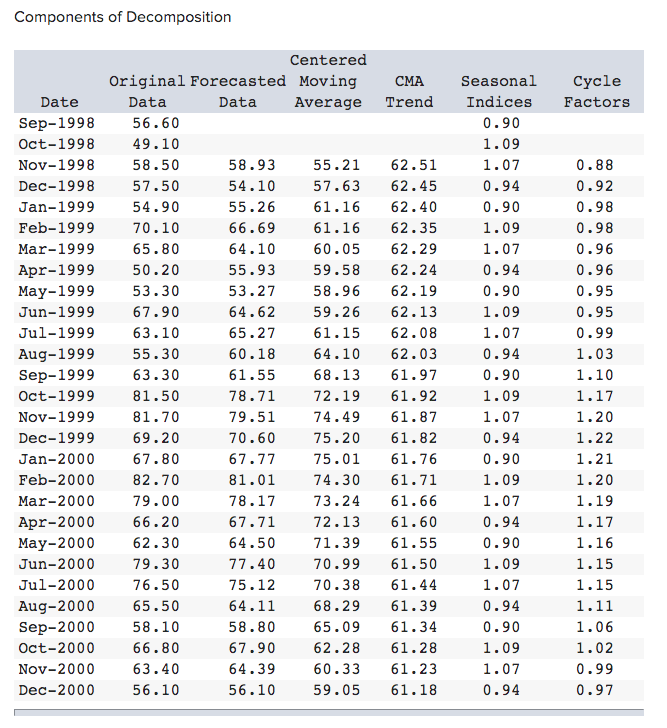
image text in transcribedimage text in transcribed
Audit Trail - Statistics Accuracy Measures Value Forecast Statistics Value AIC 309.51 Durbin Watson (4) 1 . 01 BIC 313. 82 Mean 61.54 Mean Absolute Percentage Error ( MAPE ) 3. 11$ Standard Deviation 12.70 R-Square 95. 64% Variance 161 .41 Adjusted R-Square 95 . 578 Ljung-Box 58. 17 Root Mean Square Error 2.63 Theil 0. 29 Method Statistics Value Method Selected Decomposition Basic Method Trend (Linear ) Regression Decomposition Type MultiplicativeComponents of Decomposition Centered Original Forecasted Moving CMA Seasonal Cycle Date Data Data Average Trend Indices Factors Sep-1998 56.60 0. 90 Oct-1998 49 . 10 1 . 09 Nov-1998 58 .50 58.93 55. 21 62.51 1 . 07 0 . 88 Dec-1998 57.50 54. 10 57.63 62 . 45 0.94 0.92 Jan-1999 54.90 55. 26 61. 16 62 . 40 0. 90 0.98 Feb-1999 70. 10 66.69 61. 16 62.35 1 . 09 0.98 Mar-1999 65 . 80 64. 10 60.05 62.29 1 . 07 0.96 Apr-1999 50.20 55.93 59.58 62 . 24 0.94 0.96 May-1999 53. 30 53.27 58.96 62. 19 0. 90 0.95 Jun-1999 67.90 64.62 59.26 62 . 13 1 . 09 0.95 Jul-1999 63. 10 65.27 61. 15 62 . 08 1 . 07 0.99 Aug-1999 55. 30 60 . 18 64. 10 62.03 0.94 1.03 Sep-1999 63.30 61.55 68.13 61.97 0. 90 1 . 10 Oct-1999 81. 50 78.71 72. 19 61.92 1. 09 1. 17 Nov-1999 81. 70 79.51 74.49 61. 87 1. 07 1. 20 Dec-1999 69.20 70.60 75. 20 61. 82 0.94 1. 22 Jan-2000 67.80 67.77 75 . 01 61. 76 0. 90 1 . 21 Feb-2000 82 . 70 81. 01 74.30 61. 71 1. 09 1. 20 Mar-2000 79.00 78 . 17 73. 24 61. 66 1. 07 1 . 19 Apr-2000 66.20 67.71 72. 13 61. 60 0.94 1. 17 May-2000 62.30 64.50 71.39 61.55 0.90 1 . 16 Jun-2000 79.30 77.40 70.99 61.50 1 . 09 1 . 15 Jul-2000 76.50 75 . 12 70.38 61.44 1. 07 1 . 15 Aug-2000 65.50 64. 11 68.29 61.39 0.94 1. 11 Sep-2000 58 . 10 58 . 80 65.09 61.34 0. 90 1 . 06 Oct-2000 66 . 80 67.90 62. 28 61 . 28 1 . 09 1. 02 Nov-2000 63.40 64.39 60.33 61.23 1. 07 0.99 Dec-2000 56. 10 56. 10 59 .05 61 . 18 0.94 0.97

Step by Step Solution

There are 3 Steps involved in it

Step: 1

blur-text-image

Get Instant Access to Expert-Tailored Solutions

See step-by-step solutions with expert insights and AI powered tools for academic success

Step: 2

blur-text-image_2

Step: 3

blur-text-image_3

Ace Your Homework with AI

Get the answers you need in no time with our AI-driven, step-by-step assistance

Get Started

Recommended Textbook for

Square Summable Power Series

Authors: Louis De Branges, James Rovnyak

1st Edition

0486801365, 9780486801360

More Books

Students also viewed these Mathematics questions

Question

dx x +1

Answered: 1 week ago

Question

Analyse the various techniques of training and learning.

Answered: 1 week ago