Answered step by step
Verified Expert Solution
Link Copied!

Question

1 Approved Answer

A.Us the t-statistic approach to test for linear relationship between Y and X at 5% significance level. Identify the test statistic in the regression output

A.Us the t-statistic approach to test for linear relationship between Y and X at 5% significance level. Identify the test statistic in the regression output and show how it is calculated.
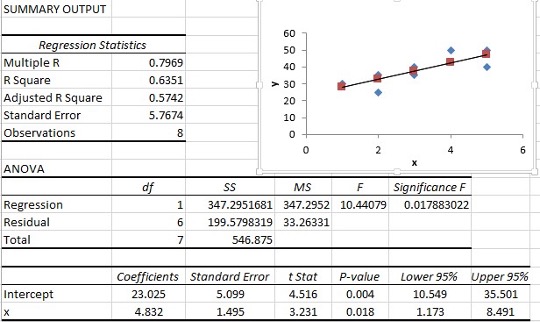
image text in transcribed
SUMMARY OUTPUT 60 Regression Statistics 50 Multiple R 0.7969 40 R Square 0.6351 > 50 Adjusted R Square 0.5742 20 Standard Error 5.7674 10 Observations 8 0 4 6 ANOVA of SS MS Significance F Regression H 347.2951681 347.2952 10.44079 0.017883022 Residual 6 199.5798319 33.26331 Total 7 546.875 Coefficients |Standard Error t Stat P-value Lower 95% Upper 95% Intercept 23.025 5.099 4.516 0.004 10.549 35.501 X 4.832 1.495 3.231 0.018 1.173 8.491

Step by Step Solution

There are 3 Steps involved in it

Step: 1

blur-text-image

Get Instant Access to Expert-Tailored Solutions

See step-by-step solutions with expert insights and AI powered tools for academic success

Step: 2

blur-text-image

Step: 3

blur-text-image

Ace Your Homework with AI

Get the answers you need in no time with our AI-driven, step-by-step assistance

Get Started

Recommended Textbook for

Intermediate Algebra With Trigonometry

Authors: Charles P McKeague

1st Edition

1483218759, 9781483218755

More Books

Students also viewed these Mathematics questions

Question

600 lb 20 0.5 ft 30 30 5 ft

Answered: 1 week ago

Question

5. Understand how cultural values influence conflict behavior.

Answered: 1 week ago

Question

8. Explain the relationship between communication and context.

Answered: 1 week ago