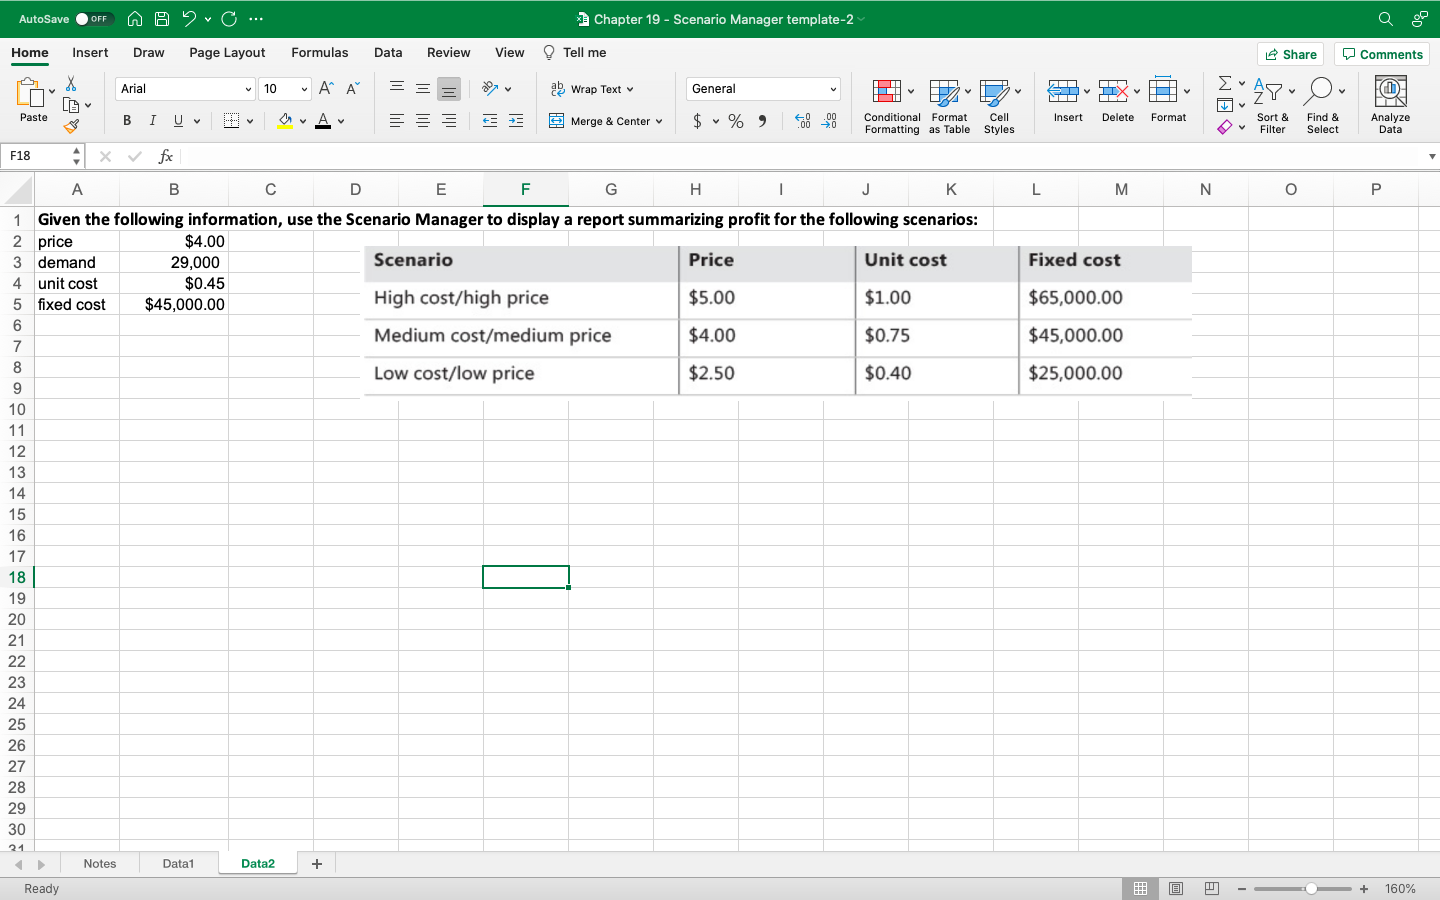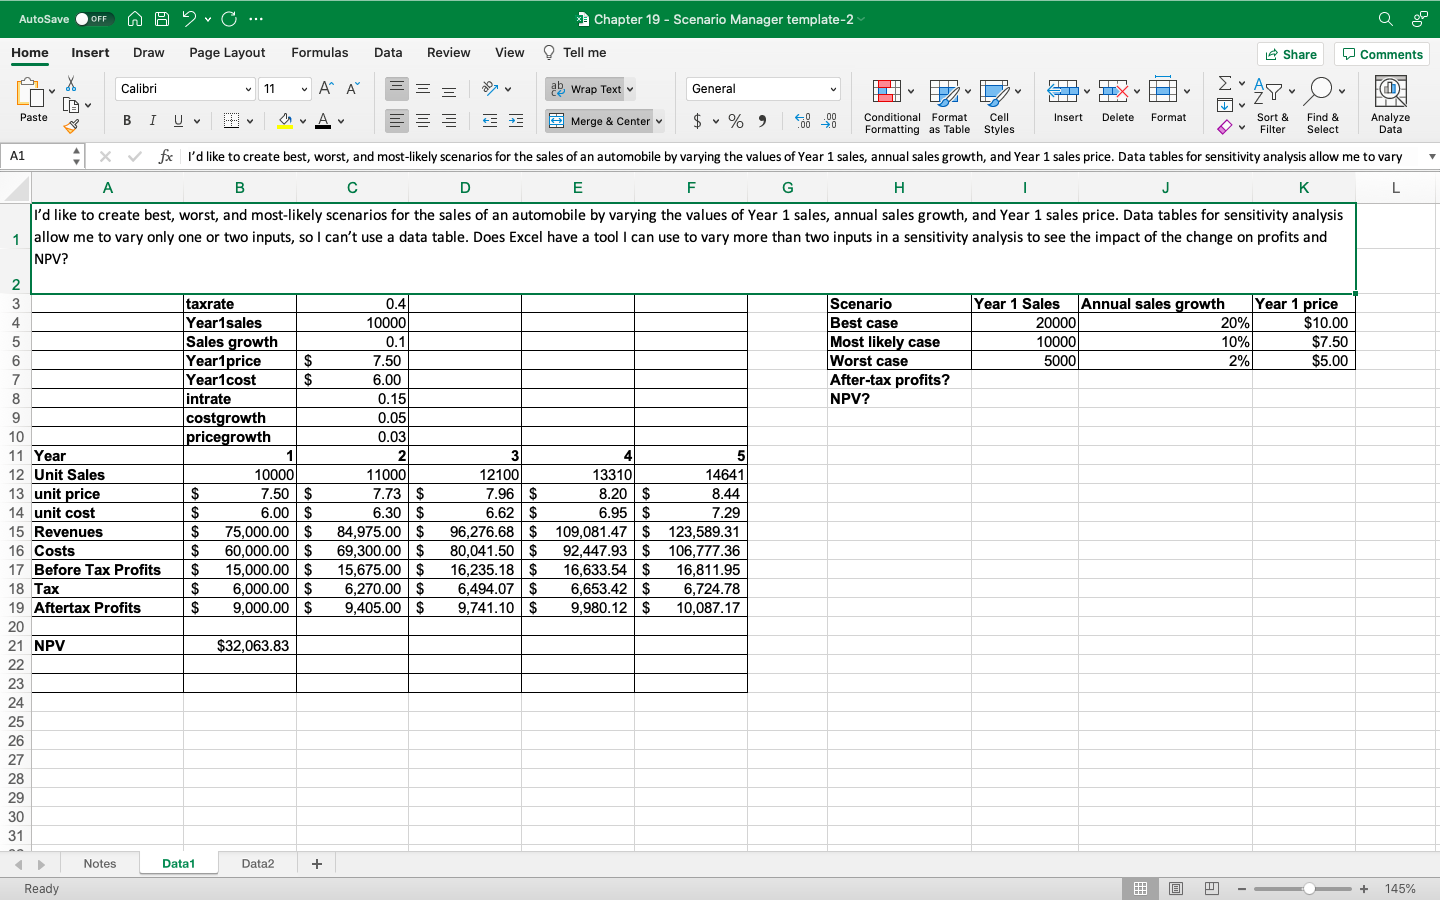

AutoSave OFF AA v C... Chapter 19 - Scenario Manager template-2 Home Insert Draw Page Layout Formulas Data Review View Tell me Share Comments Arial 10 . Ar ab Wrap Text General LIX X LO & WE 280 F Paste B IU CA FE Merge & Center $ % ) Insert Delete Format Conditional Format Cell Formatting as Table Styles v Sort & Filter Find & Select Analyze Data F18 x fx A B D E F G H 1 J K L M N o Fixed cost $65,000.00 $45,000.00 $25,000.00 1 Given the following information, use the Scenario Manager to display a report summarizing profit for the following scenarios: 2 price $4.00 3 demand 29,000 Scenario Price Unit cost 4 unit cost $0.45 $5.00 5 fixed cost High cost/high price $1.00 $45,000.00 6 Medium cost/medium price $4.00 $0.75 7 8 Low cost/low price $2.50 $0.40 9 10 11 12 13 14 15 16 17 18 19 20 21 22 23 24 25 26 27 28 29 30 21 Notes Data1 Data2 + - Ready A 160% AutoSave OFF A C... Chapter 19 - Scenario Manager template-2 Home Insert Draw Page Layout Formulas Data Review View Tell me Share Comments X Calibri 11 . Ai ab Wrap Text General LIX Ayuo F v Paste B I U Merge & Center $ % ) . Conditional Format Cell Insert Delete Format Sort & Find & Analyze Formatting as Table Styles Filter Select Data A1 x fx I'd like to create best, worst, and most-likely scenarios for the sales of an automobile by varying the values of Year 1 sales, annual sales growth, and Year 1 sales price. Data tables for sensitivity analysis allow me to vary B D E F G H J K L I'd like to create best, worst, and most likely scenarios for the sales of an automobile by varying the values of Year 1 sales, annual sales growth, and Year 1 sales price. Data tables for sensitivity analysis 1 allow me to vary only one or two inputs, so I can't use a data table. Does Excel have a tool I can use to vary more than two inputs in a sensitivity analysis to see the impact of the change on profits and NPV? taxrate Year1sales Sales growth Year1price Year1cost intrate costgrowth pricegrowth Scenario Best case Most likely case Worst case After-tax profits? NPV? Year 1 Sales Annual sales growth 20000 20% 10000 10% 5000 2% Year 1 price $10.00 $7.50 $5.00 0.4 10000 0.1 7.50 6.00 0.15 0.05 0.03 $ $ 2 3 4 5 6 7 8 9 10 11 Year 12 Unit Sales 13 unit price 14 unit cost 15 Revenues 16 Costs 17 Before Tax Profits 18 Tax 19 Aftertax Profits 20 21 NPV 22 23 24 25 26 27 28 29 30 31 $ $ $ $ $ $ $ 10000 7.50 $ 6.00 $ 75,000.00 $ 60,000.00 $ 15,000.00 $ 6,000.00 $ 9,000.00 $ 11000 7.73 $ 6.30$ 84,975.00$ 69,300.00 $ 15,675.00 $ 6,270.00 $ 9,405.00 $ 3 12100 7.96 $ 6.62 $ 96,276.68 $ 80,041.50 $ 16,235.18$ 6,494.07 $ 9,741.10$ 5 133101 146411 8.20 $ 8.44 6.95$ 7.29 109,081.47 $ 123,589.31 92,447.93 $ 106,777.36 16,633.54 $ 16,811.95 6,653.42 $ 6,724.78 9,980.12$ 10,087.17 $32,063.83 Notes Data 1 Data2 + Ready a 145% AutoSave OFF AA v C... Chapter 19 - Scenario Manager template-2 Home Insert Draw Page Layout Formulas Data Review View Tell me Share Comments Arial 10 . Ar ab Wrap Text General LIX X LO & WE 280 F Paste B IU CA FE Merge & Center $ % ) Insert Delete Format Conditional Format Cell Formatting as Table Styles v Sort & Filter Find & Select Analyze Data F18 x fx A B D E F G H 1 J K L M N o Fixed cost $65,000.00 $45,000.00 $25,000.00 1 Given the following information, use the Scenario Manager to display a report summarizing profit for the following scenarios: 2 price $4.00 3 demand 29,000 Scenario Price Unit cost 4 unit cost $0.45 $5.00 5 fixed cost High cost/high price $1.00 $45,000.00 6 Medium cost/medium price $4.00 $0.75 7 8 Low cost/low price $2.50 $0.40 9 10 11 12 13 14 15 16 17 18 19 20 21 22 23 24 25 26 27 28 29 30 21 Notes Data1 Data2 + - Ready A 160% AutoSave OFF A C... Chapter 19 - Scenario Manager template-2 Home Insert Draw Page Layout Formulas Data Review View Tell me Share Comments X Calibri 11 . Ai ab Wrap Text General LIX Ayuo F v Paste B I U Merge & Center $ % ) . Conditional Format Cell Insert Delete Format Sort & Find & Analyze Formatting as Table Styles Filter Select Data A1 x fx I'd like to create best, worst, and most-likely scenarios for the sales of an automobile by varying the values of Year 1 sales, annual sales growth, and Year 1 sales price. Data tables for sensitivity analysis allow me to vary B D E F G H J K L I'd like to create best, worst, and most likely scenarios for the sales of an automobile by varying the values of Year 1 sales, annual sales growth, and Year 1 sales price. Data tables for sensitivity analysis 1 allow me to vary only one or two inputs, so I can't use a data table. Does Excel have a tool I can use to vary more than two inputs in a sensitivity analysis to see the impact of the change on profits and NPV? taxrate Year1sales Sales growth Year1price Year1cost intrate costgrowth pricegrowth Scenario Best case Most likely case Worst case After-tax profits? NPV? Year 1 Sales Annual sales growth 20000 20% 10000 10% 5000 2% Year 1 price $10.00 $7.50 $5.00 0.4 10000 0.1 7.50 6.00 0.15 0.05 0.03 $ $ 2 3 4 5 6 7 8 9 10 11 Year 12 Unit Sales 13 unit price 14 unit cost 15 Revenues 16 Costs 17 Before Tax Profits 18 Tax 19 Aftertax Profits 20 21 NPV 22 23 24 25 26 27 28 29 30 31 $ $ $ $ $ $ $ 10000 7.50 $ 6.00 $ 75,000.00 $ 60,000.00 $ 15,000.00 $ 6,000.00 $ 9,000.00 $ 11000 7.73 $ 6.30$ 84,975.00$ 69,300.00 $ 15,675.00 $ 6,270.00 $ 9,405.00 $ 3 12100 7.96 $ 6.62 $ 96,276.68 $ 80,041.50 $ 16,235.18$ 6,494.07 $ 9,741.10$ 5 133101 146411 8.20 $ 8.44 6.95$ 7.29 109,081.47 $ 123,589.31 92,447.93 $ 106,777.36 16,633.54 $ 16,811.95 6,653.42 $ 6,724.78 9,980.12$ 10,087.17 $32,063.83 Notes Data 1 Data2 + Ready a 145%


