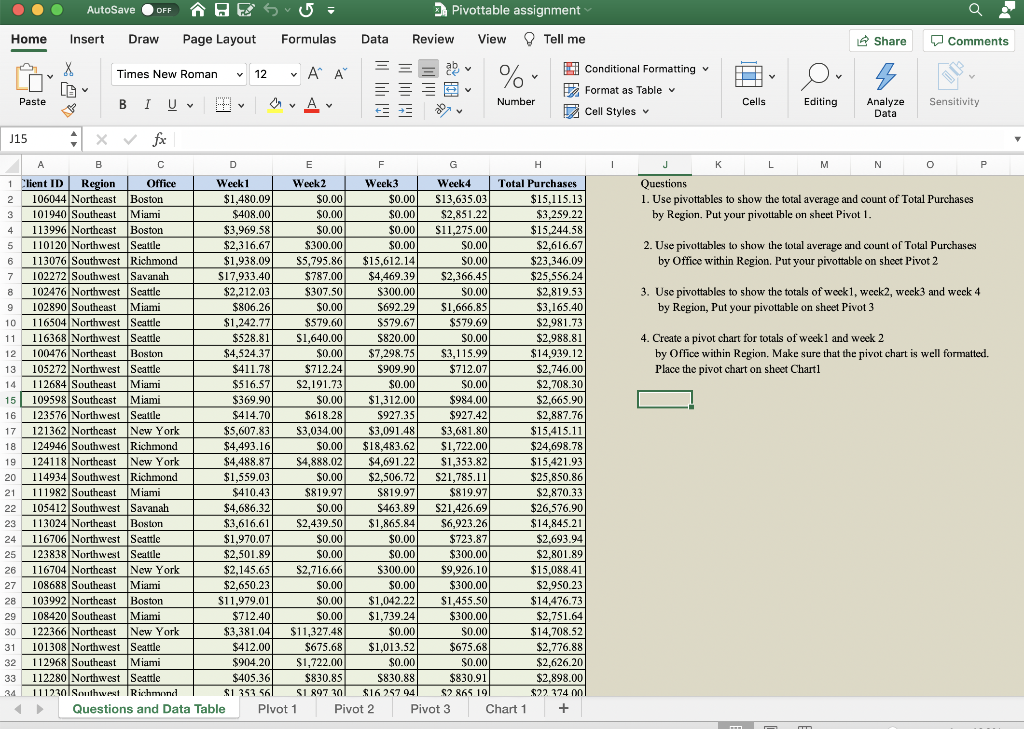
AutoSave OFF ES5 Pivottable assignment Home Insert Draw Page Layout Formulas Data Review View Tell me Share Comments X LG Times New Roman 12 ' ' ab % Piv v 5 Conditional Formatting Format as Tablev Cell Styles Paste BI U Number Cells v Editing y A V Sensitivity Analyze Data y J15 fx 1 J K L M 0 P N Questions 1. Use pivottables to show the total average and count of Total Purchases by Region. Put your pivottable on sheet Pivot 1. 2. Use pivottables to show the total average and count of Total Purchases by Office within Region. Put your pivottable on sheet Pivot 2 3. Use pivottables to show the totals of week1, weck2, week3 and week 4 by Region, Put your pivottable on sheet Pivot 3 4. Create a pivot chart for totals of weekl and week 2 by Office within Region. Make sure that the pivot chart is well formatted. Place the pivot chart on sheet Chart1 $0.00 $ B D E F H 1 Client ID Region Office Week 1 Week 2 Week3 3 Week 4 Total Purchases 2 106044 Northeast Boston $1,480.09 $0.00 $0.00 S13,635.03 $15.115.13 3 101940 Southeast Miami $408.000 $0.00 $0.00 Icela $2,851.22 $3,259.22 4 113996 Northeast Boston $3,969.58 $0.00 $0.00 $11,275.00 wave $15.244.58 5 110120 Northwest Seattle $2,316.67 $300.00 $0.00 $0.00 $2,616.67 6 113076 Southwest Richmond $1,938.09 $5,795.86 $15.612.141 een $0.00 $23,346.09 2010 we 7 102272 Southwest Savanah $17,933.40 $787.00 $4,469.39 $2,366.45 $25,556.24 8 102476 Northwest Seattle $2,212.03 $307.50 $300.00 $0.00 $2,819.53 12ools that 9 102890 Southeast Miami $806.26 $0.00 S692 29 $1,666.85 $3.165.40 10 116504 Northwest Seattle $1,242.77 $579.60 $579.67 $579.69 $2,981.73 11 116368 Northwest Seattle $528.81 $1,640.00 $820.00 S0.00 $2,988.81 12 100476 Northeast Boston $4,524.37 $0.00 $7,298.75 $3,115.99 $14,939.12 4 13 105272 Northwest Seattle $411.78 $712.24 $909.90 $712.07 $2,746.00 14 112684 Southeast Miami $516.57 S2,191.73 $0.00 $2,708.30 15 1095981 I Miami $369.90 309.90 $0.00 $ $1,312.00 $984.00 $2,665.90 16 123576 Northwest Seattle $414.70 $618,28 $927.35 $927.42 $2,887.76 $4,00 7.70 17 121362 Northeast New York $5.607.83 S3,034.00 $3,091.48 $3,681.80 $ 18 124946 Southwest Richmond $4,493.16 $0.00 $18,483.62 $1,722.00 $24,698.78 19 124118 Northeast New York $4,488.87 $4,888.02 $4,691.22 $1,353.82 $15,421.93 20 114934 Southwest Richmond $1,559.03 $0.00 $2,506.72 $21,785.11 $25,850.86 21 111982 Southeast Miami $410,43 $819.97 $819.97 $2,870.33 22 105412 Southwest Savanah $4,686.32 $0.00 $21,426.69 $26,576.90 23 113024 Northeast Boston $3,616.61 S2,439.50 $1.865.841 01.04 $6,923.26 0,725.20 $14,845.21 1,07.1.2 24 Toros de 116706 Northwest Seattle $1,970.07 $0.00 $0.00 10.U 90.00 $723.87 $2.693.94 25 123838 Northwest Seattle $2,501.89 $0.00 $0.00 $300.00 $2,801.89 26 116704 Northeast New York $2,145.65 $2,716.66 $300.00 $9,926.10 ola $15.088.41 voor 27 108688 Southeast Miami $2.650.23 $0.00 $0.00 *** $300.00 $2,950.23 28 vos 103992 Northeast Boston $11.979.01 $0.00 $1,042.22 22.01 $1,455.50 $14,476.73 29 108420 Southeast Miami $712.40 $0.00 $1,739.24 $300.00 $2.751.64 30 122366 Northeast New York $3,381.04 $11,327.48 $0.00 $0.00 $14,708.52 31 101308 Northwest Seattle $412.00 $675.68 $1.013.52 $675.68 $2.776.88 32 112968 Southeast Miami $904.20) $0.00 $0.00 $2,626.20 2 33 112280 Northwest Scattle $405.36 $830.85 $830.88 $830.91 $2.898.00 34 111230 Southwest Richmond $1 353 561 SI R97 30 $16257 941 S2 865 191 $22 374 00l Questions and Data Table Plvot 1 Pivot 2 Pivot 3 Chart 1 $819.97 $463.89 $1,722.00 + AutoSave OFF ES5 Pivottable assignment Home Insert Draw Page Layout Formulas Data Review View Tell me Share Comments X LG Times New Roman 12 ' ' ab % Piv v 5 Conditional Formatting Format as Tablev Cell Styles Paste BI U Number Cells v Editing y A V Sensitivity Analyze Data y J15 fx 1 J K L M 0 P N Questions 1. Use pivottables to show the total average and count of Total Purchases by Region. Put your pivottable on sheet Pivot 1. 2. Use pivottables to show the total average and count of Total Purchases by Office within Region. Put your pivottable on sheet Pivot 2 3. Use pivottables to show the totals of week1, weck2, week3 and week 4 by Region, Put your pivottable on sheet Pivot 3 4. Create a pivot chart for totals of weekl and week 2 by Office within Region. Make sure that the pivot chart is well formatted. Place the pivot chart on sheet Chart1 $0.00 $ B D E F H 1 Client ID Region Office Week 1 Week 2 Week3 3 Week 4 Total Purchases 2 106044 Northeast Boston $1,480.09 $0.00 $0.00 S13,635.03 $15.115.13 3 101940 Southeast Miami $408.000 $0.00 $0.00 Icela $2,851.22 $3,259.22 4 113996 Northeast Boston $3,969.58 $0.00 $0.00 $11,275.00 wave $15.244.58 5 110120 Northwest Seattle $2,316.67 $300.00 $0.00 $0.00 $2,616.67 6 113076 Southwest Richmond $1,938.09 $5,795.86 $15.612.141 een $0.00 $23,346.09 2010 we 7 102272 Southwest Savanah $17,933.40 $787.00 $4,469.39 $2,366.45 $25,556.24 8 102476 Northwest Seattle $2,212.03 $307.50 $300.00 $0.00 $2,819.53 12ools that 9 102890 Southeast Miami $806.26 $0.00 S692 29 $1,666.85 $3.165.40 10 116504 Northwest Seattle $1,242.77 $579.60 $579.67 $579.69 $2,981.73 11 116368 Northwest Seattle $528.81 $1,640.00 $820.00 S0.00 $2,988.81 12 100476 Northeast Boston $4,524.37 $0.00 $7,298.75 $3,115.99 $14,939.12 4 13 105272 Northwest Seattle $411.78 $712.24 $909.90 $712.07 $2,746.00 14 112684 Southeast Miami $516.57 S2,191.73 $0.00 $2,708.30 15 1095981 I Miami $369.90 309.90 $0.00 $ $1,312.00 $984.00 $2,665.90 16 123576 Northwest Seattle $414.70 $618,28 $927.35 $927.42 $2,887.76 $4,00 7.70 17 121362 Northeast New York $5.607.83 S3,034.00 $3,091.48 $3,681.80 $ 18 124946 Southwest Richmond $4,493.16 $0.00 $18,483.62 $1,722.00 $24,698.78 19 124118 Northeast New York $4,488.87 $4,888.02 $4,691.22 $1,353.82 $15,421.93 20 114934 Southwest Richmond $1,559.03 $0.00 $2,506.72 $21,785.11 $25,850.86 21 111982 Southeast Miami $410,43 $819.97 $819.97 $2,870.33 22 105412 Southwest Savanah $4,686.32 $0.00 $21,426.69 $26,576.90 23 113024 Northeast Boston $3,616.61 S2,439.50 $1.865.841 01.04 $6,923.26 0,725.20 $14,845.21 1,07.1.2 24 Toros de 116706 Northwest Seattle $1,970.07 $0.00 $0.00 10.U 90.00 $723.87 $2.693.94 25 123838 Northwest Seattle $2,501.89 $0.00 $0.00 $300.00 $2,801.89 26 116704 Northeast New York $2,145.65 $2,716.66 $300.00 $9,926.10 ola $15.088.41 voor 27 108688 Southeast Miami $2.650.23 $0.00 $0.00 *** $300.00 $2,950.23 28 vos 103992 Northeast Boston $11.979.01 $0.00 $1,042.22 22.01 $1,455.50 $14,476.73 29 108420 Southeast Miami $712.40 $0.00 $1,739.24 $300.00 $2.751.64 30 122366 Northeast New York $3,381.04 $11,327.48 $0.00 $0.00 $14,708.52 31 101308 Northwest Seattle $412.00 $675.68 $1.013.52 $675.68 $2.776.88 32 112968 Southeast Miami $904.20) $0.00 $0.00 $2,626.20 2 33 112280 Northwest Scattle $405.36 $830.85 $830.88 $830.91 $2.898.00 34 111230 Southwest Richmond $1 353 561 SI R97 30 $16257 941 S2 865 191 $22 374 00l Questions and Data Table Plvot 1 Pivot 2 Pivot 3 Chart 1 $819.97 $463.89 $1,722.00 +