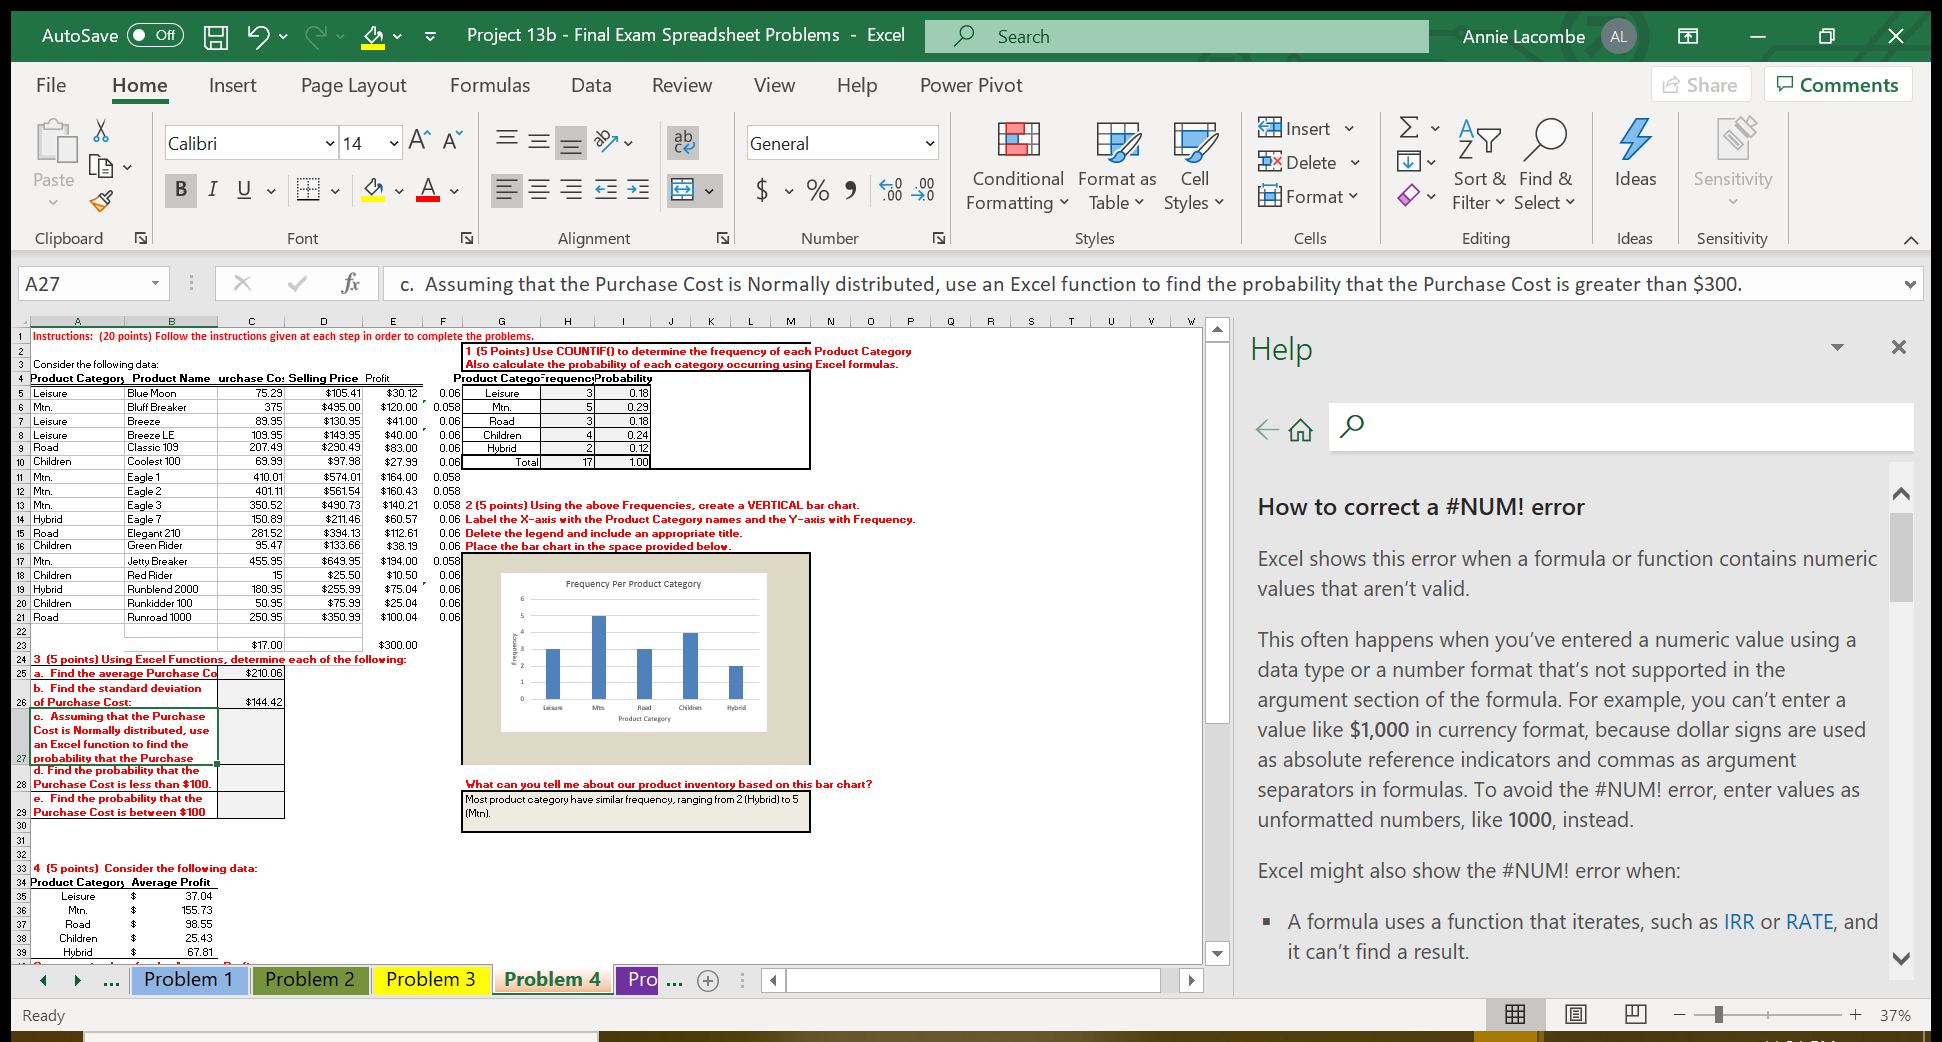
AutoSave . Off Hu v Project 13b - Final Exam Spreadsheet Problems - Excel 9 Search Annie Lacombe AL X File Home Insert Page Layout Formulas Data Review View Help Power Pivot Share Comments Calibri 14 ~ A" A ab General Insert Ex APO Paste CA BIU EE EE v $ ~ % 9 .00 Conditional Format as Cell x Delete ~ Sort & Find & Sensitivity Formatting " Table Styles Format Ideas Filter ~ Select v Clipboard Font Alignment IN Number Styles Cells Editing Ideas Sensitivity A27 X Y c. Assuming that the Purchase Cost is Normally distributed, use an Excel function to find the probability that the Purchase Cost is greater than $300. B C D E G K 2 Instructions: (20 points) Follow the instructions given at each step in order to complete the problems. M N O F Q R S T U V W 1 (5 Points) Use COUNTIF() to determine the frequency of each Product Category Help X 3 Consider the following data Also calculate the probability of each category occurring using Excel formulas. 4 Product Category Product Name urchase Co: Selling Price Profit Product Catego requenc Probability 5 Leisure Blue Moon 75.29 $105.41 $30.12 0.06 Leisure 0. 18 6 Min. Bluff Breaker 3 375 7 Le $495.00 $120.00 0.058 Men. 0.29 Breez 39.95 $130.95 $149.95 $41.00 0.06 5 Road 8 Leisure Breeze LE 109.95 3 9 Road Classic 109 207.49 $290.49 $40.00 0.06 Children 0.24 10 Children Coolest 100 69.99 $97.98 $83.00 0.06 Hybrid $27.99 0.06 Total 2 17 1.00 11 Min. Eagle 1 410.01 $574.01 0.058 12 Min. Eagle 2 401.11 $561.54 $164.00 $160.43 0.058 13 Min. Eagle 3 350.52 $490.73 $140.21 14 Hybrid 150.89 $211.46 0.058 2 (5 points] Using the above Frequencies. create a VERTICAL bar chart. Eagle 7 $60.57 15 Road Elegant 210 $394. 13 $112.61 0.06 Label the X-axis with the Product Category names and the Y-axis with Frequency. How to correct a #NUM! error 16 Children Green Ride 281.52 95.47 $133.66 0.06 Delete the legend and include an appropriate title $38.19 0.06 Place the bar chart in the space provided below. 17 Min. Jetty Breaker 455.95 $649.95 $194.00 0.058 18 Children Red Rider 15 $25 50 $10.50 0.06 Excel shows this error when a formula or function contains numeric 19 Hybrid Runblend 2000 80.95 255.99 $75.04 0.06 Frequency Per Product Category 20 Children Runkidder 100 50.95 $75 99 $25.04 0.06 values that aren't valid. 21 Road Runroad 1000 250.95 350.99 $100.04 0.06 22 23 :17.00 $300.00 This often happens when you've entered a numeric value using a 24 3 (5 points) Using Excel Functions, determine each of the following: 25 a. Find the average Purchase Co $210.06 b. Find the standard deviation data type or a number format that's not supported in the 26 of Purchase Cost: $144.42 . Assuming that the Purchase Read Children Hybrid argument section of the formula. For example, you can't enter a Cost is Normally distributed, use Product Category an Excel function to find the value like $1,000 in currency format, because dollar signs are used probability that the Purchase d. Find the probability that the as absolute reference indicators and commas as argument 28 Purchase Cost is less than $100 e. Find the probability that the What can you tell me about our product inventory based on this bar chart? |Most product category have similar frequency, ranging from 2 (Hybrid] to 5 separators in formulas. To avoid the #NUM! error, enter values as 29 Purchase Cost is between $100 (Men). 30 31 unformatted numbers, like 1000, instead. 32 33 4 (5 points) Consider the following data: 34 Product Category Average Profit Excel might also show the #NUM! error when: 35 Leisure 37.04 36 155.73 37 Road 98.55 38 Children 25.43 A formula uses a function that iterates, such as IRR or RATE, and 39 Hybrid 67.81 it can't find a result. Problem 1 Problem 2 Problem 3 Problem 4 Pro ... + : 4 Ready + 37%


