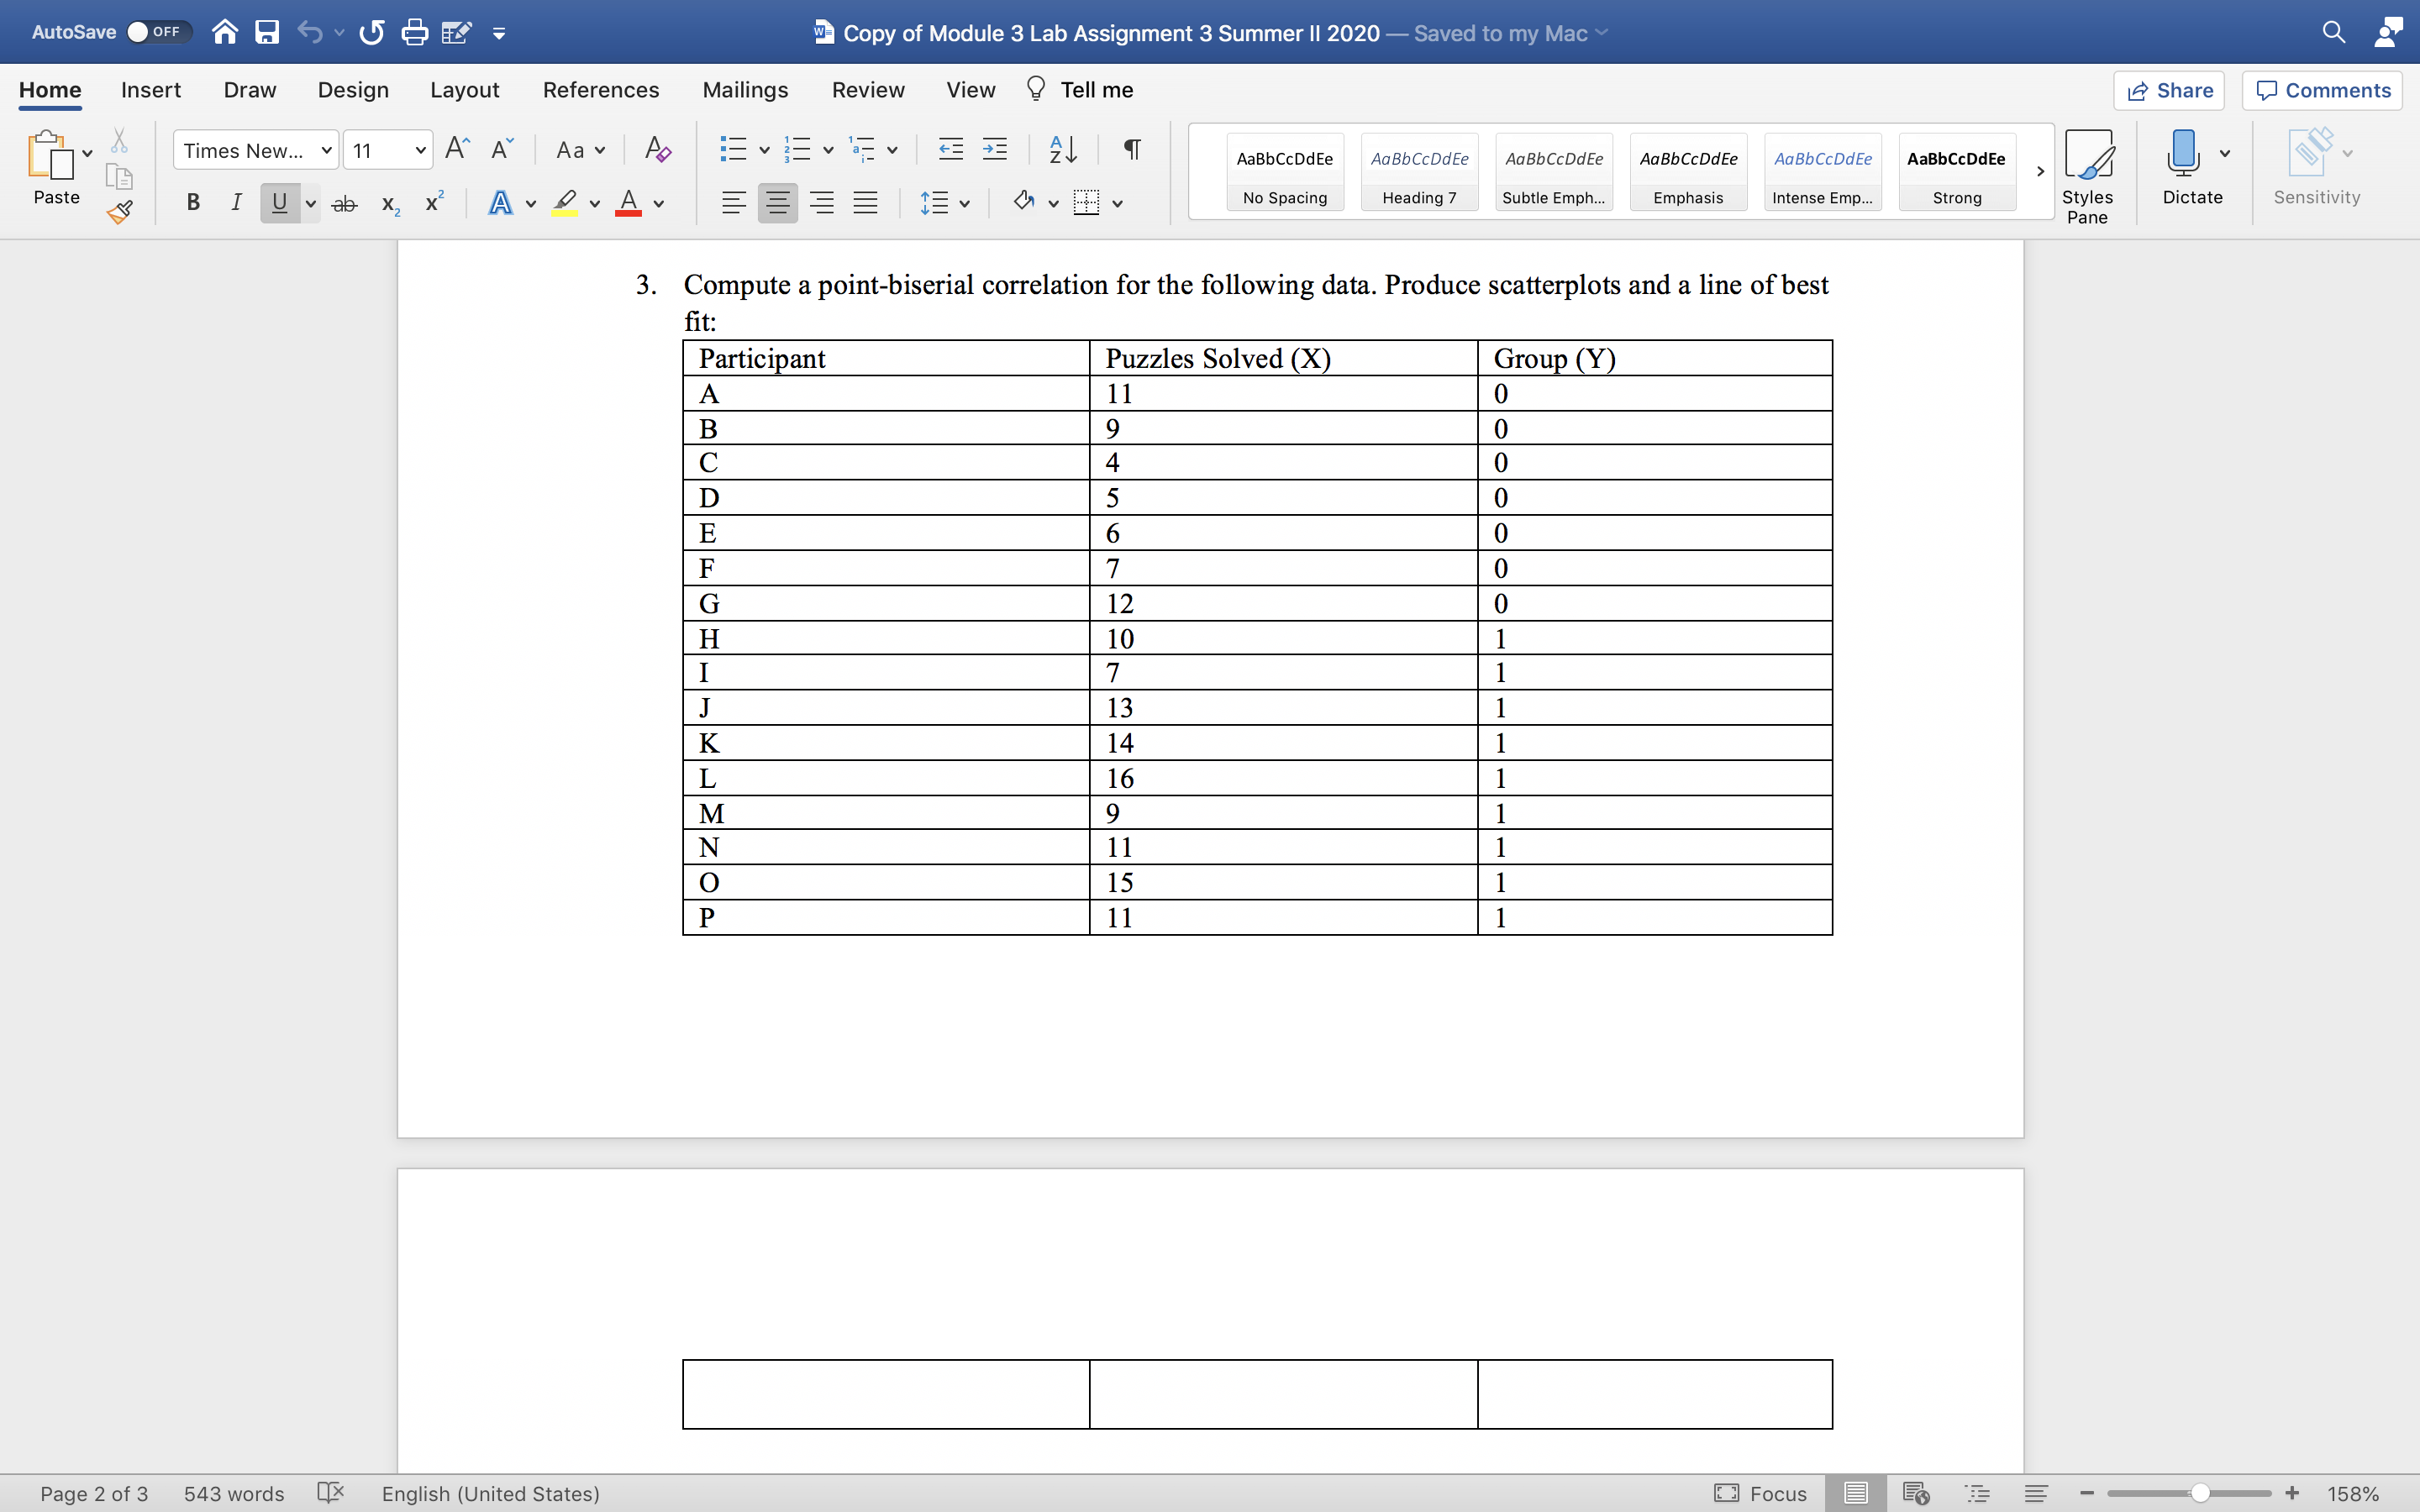
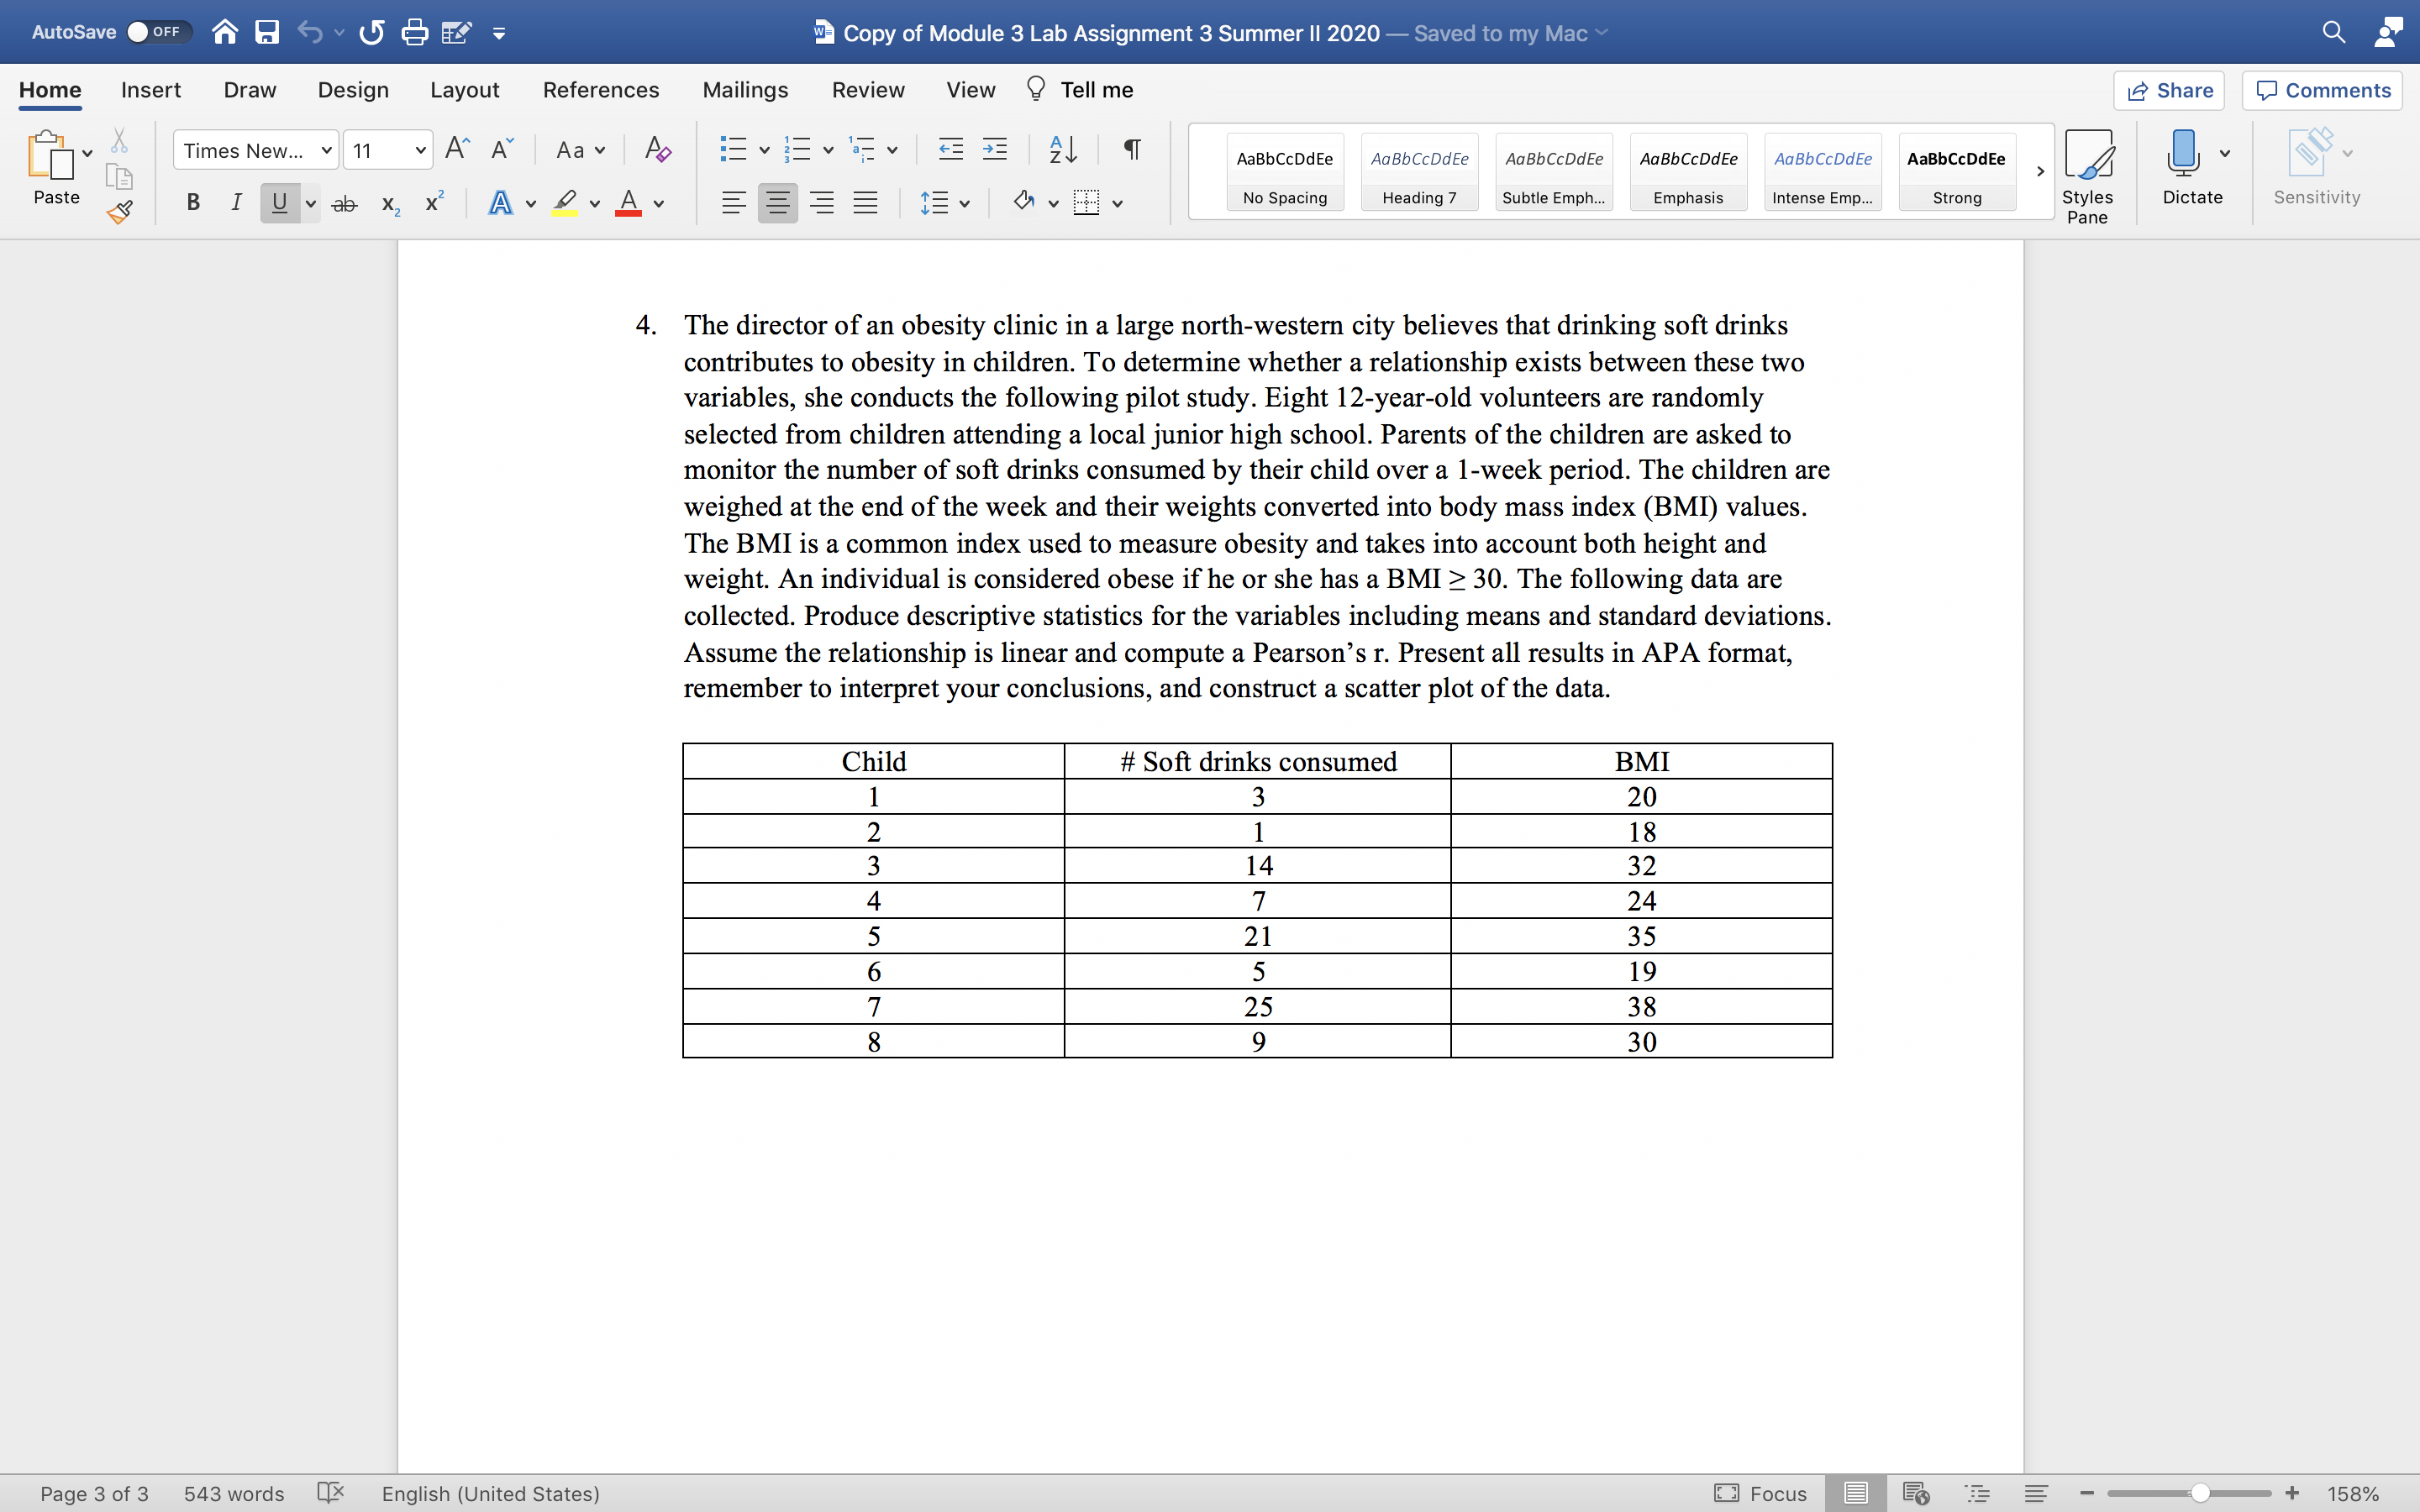
AutoSave OFF w- Copy of Module 3 Lab Assignment 3 Summer II 2020 - Saved to my Mac Home Insert Draw Design Layout References Mailings Review View ? Tell me Share Comments Times New... v 11 A" A Aa Ap AaBbCcDdEe AaBbCcDdEe AaBbCcDdEe AaBbCcDdEe AaBbCcDdEe AaBbCcDdEe Paste BI Uvab X X A DAY No Spacing Heading 7 Subtle Emph Emphasis Intense Emp.. Strong Styles Dictate Sensitivity Pane 3. Compute a point-biserial correlation for the following data. Produce scatterplots and a line of best fit: Participant Puzzles Solved (X) Group (Y) A 11 0 B 9 0 C 4 0 D 5 0 E 6 0 F 7 0 G 12 0 H 10 1 I 7 J 13 K 14 1 L 16 1 M 9 N 11 15 P 11 1 Page 2 of 3 543 words X English (United States) Focus + 158%AutoSave . on {5' Q 3 Copy of Module 3 Lab Assignment 3 Summer II 2020 Home Insert Draw Design Layout References Mailings Review View 9 Tell me '3 Share E Comments X T' N v11 vA\"AV Av A Zvizv'atv I 7 V [El Imes ew... a 0 a . AaBchDdEe AaBchDdEe Aasbcwdss Aasbcwdse AaEbCdeEe AaBchDdEe > Lg} " V Paste 6 B I ii v ab X, x' A v I v A v E NoSpacing Heading7 SubtleEmph... Emphasis lntenseEmp... Strong Styles Dictate Sensitivity Pane 4. The director of an obesity clinic in a large northwestem city believes that drinking soft drinks contributes to obesity in children. To determine whether a relationship exists between these two variables, she conducts the following pilot study. Eight 12-year-old volunteers are randomly selected from children attending a local junior high school. Parents of the children are asked to monitor the number of so drinks consumed by their child over a 1week period. The children are weighed at the end of the week and their weights converted into body mass index (BMI) values. The BMI is a common index used to measure obesity and takes into account both height and weight, An individual is considered obese if he or she has a BMI 2 30. The following data are collected. Produce descriptive statistics for the variables including means and standard deviations. Assume the relationship is linear and compute a Pearson's r. Present all results in APA format, remember to interpret your conclusions, and construct a scatter plot of the data. Child # Soft drinks consumed BMI l 3 20 2 1 18 3 14 32 4 7 24 5 21 35 6 5 19 7 25 3 8 8 9 30 Page 3 of 3 543 words [13 English (United States) . . Focus n Fe _ _\\J + 153%


