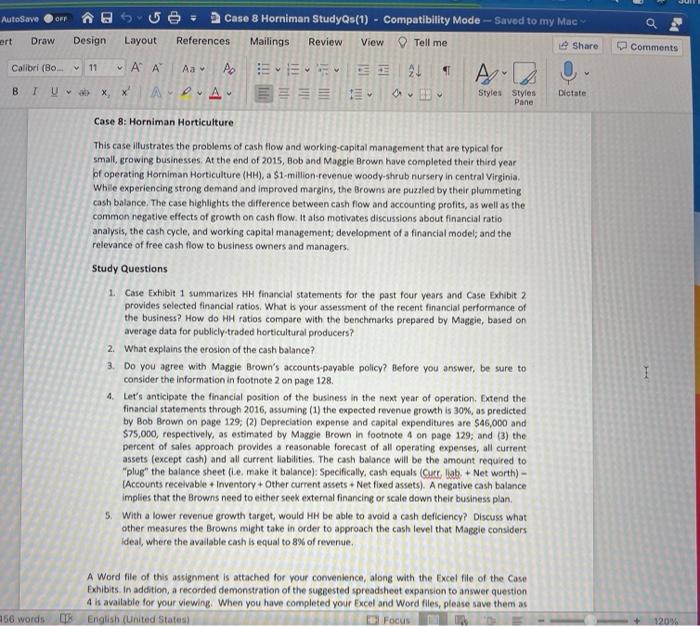
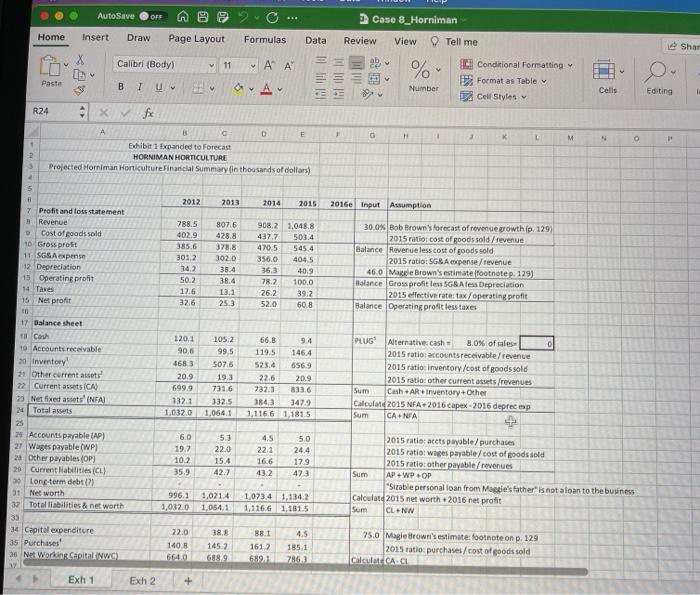
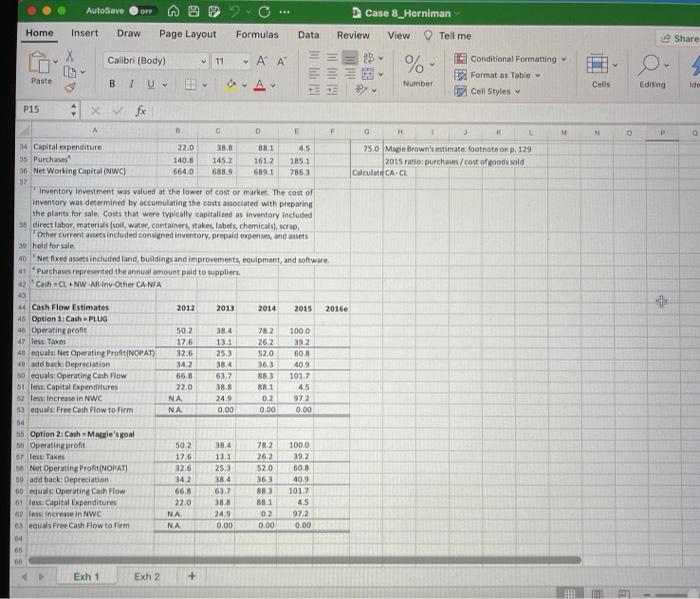
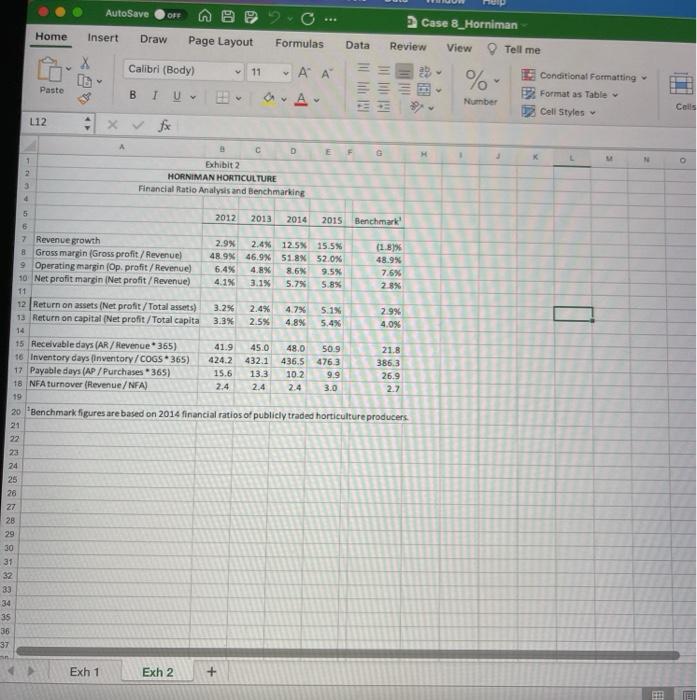
AutoSave OFT Case 8 Horniman StudyQs(1) - Compatibility Mode - Saved to my Mac References Mailings Review View Tell me Share ert Draw Design Layout Comments Calibri (Bo. 11 v AA Ao Ev==v= = - x x ADA ==== 2 24 Ar Styles Styles Pane Dictate Case 8: Horniman Horticulture This case illustrates the problems of cash flow and working-capital management that are typical for small, growing businesses. At the end of 2015, Bob and Maggie Brown have completed their third year bf operating Horniman Horticulture (HH), a $1 million-revenue woody-shrub nursery in central Virginia While experiencing strong demand and improved margins, the Browns are puzzled by their plummeting cash balance. The case highlights the difference between cash flow and accounting profits, as well as the common negative effects of growth on cash flow. It also motivates discussions about financial ratio analysis, the cash cycle, and working capital management development of a financial model and the relevance of free cash flow to business owners and managers. Study Questions 1. Case Exhibit 1 summarizes HH financial statements for the past four years and Case Exhibit 2 provides selected financial ratios. What is your assessment of the recent financial performance of the business? How do HH ratios compare with the benchmarks prepared by Maggie, based on average data for publicly traded horticultural producers? 2. What explains the erosion of the cash balance? 3. Do you agree with Maggie Brown's accounts payable policy? Before you answer, be sure to consider the information in footnote 2 on page 128. 4. Let's anticipate the financial position of the business in the next year of operation. Extend the financial statements through 2016, assuming (1) the expected revenue growth is 30%, as predicted by Bob Brown on page 129; (2) Depreciation expense and capital expenditures are $46,000 and $75,000, respectively, as estimated by Maggie Brown in footnote 4 on page 129; and (3) the percent of sales approach provides a reasonable forecast of all operating expenses, all current assets (except cash) and all current liabilities. The cash balance will be the amount required to "plug" the balance sheet (le, make it balance): Specifically, cash equals (Cuer lab + Net worth) - (Accounts receivable + Inventory +Other current assets + Net fixed assets). A negative cash balance implies that the Browns need to either seek external financing or scale down their business plan 5. With a lower revenue growth target, would HH be able to avoid a cash deficiency? Discuss what other measures the Browns might take in order to approach the cash level that Maggie considers Ideal, where the available cash is equal to 8% of revenue, 1 A Word file of this assignment is attached for your convenience, along with the Excel file of the Case Exhibits. In addition, a recorded demonstration of the suggested spreadsheet expansion to answer question 4 is available for your viewing. When you have completed your Excel and Word files, please save them as English (United States) Focus 156 words DE 1204 AutoSave OFF Case 8_Horniman Home Insert Draw Page Layout Formulas Data Review View Shar X Calibri (Body) 11 ~ A A 29 % v 1191 Tell me Conditional Formatting Format as Table Cell Styles Paste B IU F Number Cells Editing R24 x fx F 0 H M N O A B D E Exhibit 1 Expanded to Forecast HORNIMAN HORTICULTURE Projected Horniman Horticulture Financial Summary in thousands of dollars) 2 3 5 2012 2013 2014 2015 2016 Input Assumption 7 Profit and loss statement Revenue Cost of gods sold 10. Gross profit 11 SGSA expense 12 Depreciation 13 Operating profit 14 Taxes 15 Net profit 788.5 402.9 385.6 3012 342 502 17.6 32.6 8076 428.8 378.8 302.0 35.4 38.4 13.1 25.3 908,2 1,048.8 437,7 503.4 420.5 545.4 356.0 4045 40.9 78.2 100.0 26.2 39.2 52.0 60.8 30.0% Bob Brown's forecast of revenue growth in 1291 2015 ratio: cost of goods sold / revenue Balance Revenue less cost of goods sold 2015 ratio: SG&A expense/revenue 46.0 Mark Brown's estimate footnotep. 129) Balance Gross profit less SG Aless Depreciation 2015 effective rate:tax/operating profit Balance Operating profit less taxes 0 17 Balance sheet Cash 10 Accounts receivable 20 Inventory 21. Other current assets 22 Current assets ICA) 23 Net fixed assets" (NFA) 24 Total assets 1201 90,6 4683 20.9 6999 1321 1,032.0 105.2 99.5 507.6 19.3 7316 3325 1.064.1 66.B 9.4 119.5 146.4 525.4 6569 22.6 20.9 7323 3843 3479 1.116.6 1,1815 PLUGO Alternative cash 8.0% of sales 2015 ratio accounts receivable/revenue 2015 ratio inventory/cost of goods sold 2015 ratio other current assets revenues Sum Cash AR Inventory Other Calculate 2015 NFA+2016 capex 2016 deprecap Sum CANIA 1336 6.0 19.7 10.2 35.9 53 22.0 15.4 42.7 4.5 22.1 16.6 43.2 5.0 24.4 179 473 24 Accounts payable (AP) 27 Wages payable (WP) 2. Other payables (OP) 20 Current liabilities (CL) 30 Long-term debt (7) 31 Net worth 32 Total liabilities & net worth 33 34 Capital expenditure 35 Purchases 36 Net Working Capital (WC) 2015 ratio acets payable/ purchases 2015 ratio: wages payable/cost of goods sold 2015 ratio: other payable/revenues Sum AP .WPOP "Sizable personal loan from Mastie's father is not aloan to the business Calculate 2015 net worth 2016 net profit Sum CLNW 996.1 1,032.0 1,0214 1,054.1 1,073.4 1,134.2 1,1166 1.131.5 881 22.0 140.B 38 145.2 688.9 4.5 185.1 1612 6893 25.0 Magie Brown's estimate: footnote on p. 129 2015 ratio purchases/cost of goods sold Calculat CA. Exh 1 Exh 2 AutoSave OFF Case 8_Horniman Home Insert Draw Page Layout Formulas Data Review View Tell me Share Calibri (Body) 11 - A A 25 % 2 v Conditional Formatting Format : Table Cell Styles Paste A Number Cells Editing Ida P15 0x fx N P 4 A IS D 1 F G H K 34 Capital expenditure 22.0 388 88.1 4.5 25.0 Magierown's estimate footnote on p. 129 15 Purchase 1408 1452 1612 1851 2015 ratio purchases/cost of coods sold 30 Net Working Capital INWC) 6640 6889 7863 CalculateCA.CL Inventory Investment was valued at the lower of cost or market. The cost of inventory was determined by accumulating the costs sociated with preparing the plants for sale costs that were typically capitalired as inventory included direct labor, materials soll, water, containers, stakes, labels, chemicals, scrap Other current assets included consigned inventory, prepaid expenses and assets 3 held for sale 40 Netflxed assets included and buildings and improvements, equipment, and software 4+ Purchases represented the annual amount paid to suppliers 42 Cash CL NW-Al.Inv-Other CA-NIA 43 4 Cash Flow Estimates 2012 2013 2014 2015 2016 45 Option 1: Cash PLUG 40 Operating profit 50.2 38.4 782 100.0 47 les taxes 176 13,1 262 392 43 equals: Net Operating ProfiNOPAT) 32.6 253 520 608 40 add back Depreciation 142 384 363 409 o equals: Operating Cash Flow 66.8 63.7 883 101.7 51 less. Capital Expenditures 22.0 38.8 881 45 s less increase in NWC NA 24.9 0.2 972 10 equals Free Cash Flow to Firm NA 0.00 0.00 0.00 54 56 Option 2 Cash Magle's goal 06 Operating profit 50.2 38.4 782 100.0 o less Takes 17,6 13.1 262 19.2 16 Net Operating ProfitNOPAT) 32.6 520 50 add back Depreciation 34,2 38.4 363 40.9 o equals: Operating Cath Flow 66,8 63.7 883 101.7 01 less. Capital Expenditures 22.0 38.8 B1 4.5 62 less increase in NWC NA 249 0.2 972 03 equals Free Cash Flow to Form NA 0.00 0.00 0.00 04 25 505 03 OB Exh 1 Exh 2 AutoSave OFF ce Case 8_Horniman Home Insert Draw Page Layout Formulas Data Review View Tell me Calibri (Body) 11 ' A Milli % Paste BE HUB BIU Conditional Formatting Format as Table Cell Styles v v Number Cails L12 fx A E F G 1 2 3 D Exhibit 2 HORNIMAN HORTICULTURE Financial Ratio Analysis and Benchmarking 4 - 133 5 2012 2013 2014 2015 Benchmark 6 7 Revenue growth 2.9% 2.4% 12.5% 15.5% (1.8% 8 Gross margin (Gross profit/ Revenue) 48.9% 46.9% 51.8% 52.0% 48.9% 9 Operating margin (Op. profit / Revenue) 6.4% 4.8% 8.6% 9.5% 7.6% 10 Net profit margin (Net profit/Revenue) 4.1% 3.1% 5.7% 5.8% 2.8% 11 12 Return on assets (Net profit/Total assets) 3.2% 2.4% 4.7% 5.1% 2.9% 13 Return on capital (Net profit/Total capita 3.3% 2.5% 4.8% 5.4% 4.0% 14 15 Receivable days (AR/Revenue 365) 41.9 45.0 48.0 50.9 21.8 16 Inventory days (Inventory/COGS365) 424.2 432.1 436.5 4763 386.3 17 Payable days (AP/Purchases -365) 15.6 10.2 9.9 26.9 18 NFA turnover (Revenue/NFA) 2.4 2.4 2.4 3.0 2.7 19 20 Benchmark figures are based on 2014 financial ratios of publicly traded horticulture producers 121 22 23 24 25 26 27 28 29 30 31 32 33 -34 35 36 37 - Exh 1 Exh 2 + AutoSave OFT Case 8 Horniman StudyQs(1) - Compatibility Mode - Saved to my Mac References Mailings Review View Tell me Share ert Draw Design Layout Comments Calibri (Bo. 11 v AA Ao Ev==v= = - x x ADA ==== 2 24 Ar Styles Styles Pane Dictate Case 8: Horniman Horticulture This case illustrates the problems of cash flow and working-capital management that are typical for small, growing businesses. At the end of 2015, Bob and Maggie Brown have completed their third year bf operating Horniman Horticulture (HH), a $1 million-revenue woody-shrub nursery in central Virginia While experiencing strong demand and improved margins, the Browns are puzzled by their plummeting cash balance. The case highlights the difference between cash flow and accounting profits, as well as the common negative effects of growth on cash flow. It also motivates discussions about financial ratio analysis, the cash cycle, and working capital management development of a financial model and the relevance of free cash flow to business owners and managers. Study Questions 1. Case Exhibit 1 summarizes HH financial statements for the past four years and Case Exhibit 2 provides selected financial ratios. What is your assessment of the recent financial performance of the business? How do HH ratios compare with the benchmarks prepared by Maggie, based on average data for publicly traded horticultural producers? 2. What explains the erosion of the cash balance? 3. Do you agree with Maggie Brown's accounts payable policy? Before you answer, be sure to consider the information in footnote 2 on page 128. 4. Let's anticipate the financial position of the business in the next year of operation. Extend the financial statements through 2016, assuming (1) the expected revenue growth is 30%, as predicted by Bob Brown on page 129; (2) Depreciation expense and capital expenditures are $46,000 and $75,000, respectively, as estimated by Maggie Brown in footnote 4 on page 129; and (3) the percent of sales approach provides a reasonable forecast of all operating expenses, all current assets (except cash) and all current liabilities. The cash balance will be the amount required to "plug" the balance sheet (le, make it balance): Specifically, cash equals (Cuer lab + Net worth) - (Accounts receivable + Inventory +Other current assets + Net fixed assets). A negative cash balance implies that the Browns need to either seek external financing or scale down their business plan 5. With a lower revenue growth target, would HH be able to avoid a cash deficiency? Discuss what other measures the Browns might take in order to approach the cash level that Maggie considers Ideal, where the available cash is equal to 8% of revenue, 1 A Word file of this assignment is attached for your convenience, along with the Excel file of the Case Exhibits. In addition, a recorded demonstration of the suggested spreadsheet expansion to answer question 4 is available for your viewing. When you have completed your Excel and Word files, please save them as English (United States) Focus 156 words DE 1204 AutoSave OFF Case 8_Horniman Home Insert Draw Page Layout Formulas Data Review View Shar X Calibri (Body) 11 ~ A A 29 % v 1191 Tell me Conditional Formatting Format as Table Cell Styles Paste B IU F Number Cells Editing R24 x fx F 0 H M N O A B D E Exhibit 1 Expanded to Forecast HORNIMAN HORTICULTURE Projected Horniman Horticulture Financial Summary in thousands of dollars) 2 3 5 2012 2013 2014 2015 2016 Input Assumption 7 Profit and loss statement Revenue Cost of gods sold 10. Gross profit 11 SGSA expense 12 Depreciation 13 Operating profit 14 Taxes 15 Net profit 788.5 402.9 385.6 3012 342 502 17.6 32.6 8076 428.8 378.8 302.0 35.4 38.4 13.1 25.3 908,2 1,048.8 437,7 503.4 420.5 545.4 356.0 4045 40.9 78.2 100.0 26.2 39.2 52.0 60.8 30.0% Bob Brown's forecast of revenue growth in 1291 2015 ratio: cost of goods sold / revenue Balance Revenue less cost of goods sold 2015 ratio: SG&A expense/revenue 46.0 Mark Brown's estimate footnotep. 129) Balance Gross profit less SG Aless Depreciation 2015 effective rate:tax/operating profit Balance Operating profit less taxes 0 17 Balance sheet Cash 10 Accounts receivable 20 Inventory 21. Other current assets 22 Current assets ICA) 23 Net fixed assets" (NFA) 24 Total assets 1201 90,6 4683 20.9 6999 1321 1,032.0 105.2 99.5 507.6 19.3 7316 3325 1.064.1 66.B 9.4 119.5 146.4 525.4 6569 22.6 20.9 7323 3843 3479 1.116.6 1,1815 PLUGO Alternative cash 8.0% of sales 2015 ratio accounts receivable/revenue 2015 ratio inventory/cost of goods sold 2015 ratio other current assets revenues Sum Cash AR Inventory Other Calculate 2015 NFA+2016 capex 2016 deprecap Sum CANIA 1336 6.0 19.7 10.2 35.9 53 22.0 15.4 42.7 4.5 22.1 16.6 43.2 5.0 24.4 179 473 24 Accounts payable (AP) 27 Wages payable (WP) 2. Other payables (OP) 20 Current liabilities (CL) 30 Long-term debt (7) 31 Net worth 32 Total liabilities & net worth 33 34 Capital expenditure 35 Purchases 36 Net Working Capital (WC) 2015 ratio acets payable/ purchases 2015 ratio: wages payable/cost of goods sold 2015 ratio: other payable/revenues Sum AP .WPOP "Sizable personal loan from Mastie's father is not aloan to the business Calculate 2015 net worth 2016 net profit Sum CLNW 996.1 1,032.0 1,0214 1,054.1 1,073.4 1,134.2 1,1166 1.131.5 881 22.0 140.B 38 145.2 688.9 4.5 185.1 1612 6893 25.0 Magie Brown's estimate: footnote on p. 129 2015 ratio purchases/cost of goods sold Calculat CA. Exh 1 Exh 2 AutoSave OFF Case 8_Horniman Home Insert Draw Page Layout Formulas Data Review View Tell me Share Calibri (Body) 11 - A A 25 % 2 v Conditional Formatting Format : Table Cell Styles Paste A Number Cells Editing Ida P15 0x fx N P 4 A IS D 1 F G H K 34 Capital expenditure 22.0 388 88.1 4.5 25.0 Magierown's estimate footnote on p. 129 15 Purchase 1408 1452 1612 1851 2015 ratio purchases/cost of coods sold 30 Net Working Capital INWC) 6640 6889 7863 CalculateCA.CL Inventory Investment was valued at the lower of cost or market. The cost of inventory was determined by accumulating the costs sociated with preparing the plants for sale costs that were typically capitalired as inventory included direct labor, materials soll, water, containers, stakes, labels, chemicals, scrap Other current assets included consigned inventory, prepaid expenses and assets 3 held for sale 40 Netflxed assets included and buildings and improvements, equipment, and software 4+ Purchases represented the annual amount paid to suppliers 42 Cash CL NW-Al.Inv-Other CA-NIA 43 4 Cash Flow Estimates 2012 2013 2014 2015 2016 45 Option 1: Cash PLUG 40 Operating profit 50.2 38.4 782 100.0 47 les taxes 176 13,1 262 392 43 equals: Net Operating ProfiNOPAT) 32.6 253 520 608 40 add back Depreciation 142 384 363 409 o equals: Operating Cash Flow 66.8 63.7 883 101.7 51 less. Capital Expenditures 22.0 38.8 881 45 s less increase in NWC NA 24.9 0.2 972 10 equals Free Cash Flow to Firm NA 0.00 0.00 0.00 54 56 Option 2 Cash Magle's goal 06 Operating profit 50.2 38.4 782 100.0 o less Takes 17,6 13.1 262 19.2 16 Net Operating ProfitNOPAT) 32.6 520 50 add back Depreciation 34,2 38.4 363 40.9 o equals: Operating Cath Flow 66,8 63.7 883 101.7 01 less. Capital Expenditures 22.0 38.8 B1 4.5 62 less increase in NWC NA 249 0.2 972 03 equals Free Cash Flow to Form NA 0.00 0.00 0.00 04 25 505 03 OB Exh 1 Exh 2 AutoSave OFF ce Case 8_Horniman Home Insert Draw Page Layout Formulas Data Review View Tell me Calibri (Body) 11 ' A Milli % Paste BE HUB BIU Conditional Formatting Format as Table Cell Styles v v Number Cails L12 fx A E F G 1 2 3 D Exhibit 2 HORNIMAN HORTICULTURE Financial Ratio Analysis and Benchmarking 4 - 133 5 2012 2013 2014 2015 Benchmark 6 7 Revenue growth 2.9% 2.4% 12.5% 15.5% (1.8% 8 Gross margin (Gross profit/ Revenue) 48.9% 46.9% 51.8% 52.0% 48.9% 9 Operating margin (Op. profit / Revenue) 6.4% 4.8% 8.6% 9.5% 7.6% 10 Net profit margin (Net profit/Revenue) 4.1% 3.1% 5.7% 5.8% 2.8% 11 12 Return on assets (Net profit/Total assets) 3.2% 2.4% 4.7% 5.1% 2.9% 13 Return on capital (Net profit/Total capita 3.3% 2.5% 4.8% 5.4% 4.0% 14 15 Receivable days (AR/Revenue 365) 41.9 45.0 48.0 50.9 21.8 16 Inventory days (Inventory/COGS365) 424.2 432.1 436.5 4763 386.3 17 Payable days (AP/Purchases -365) 15.6 10.2 9.9 26.9 18 NFA turnover (Revenue/NFA) 2.4 2.4 2.4 3.0 2.7 19 20 Benchmark figures are based on 2014 financial ratios of publicly traded horticulture producers 121 22 23 24 25 26 27 28 29 30 31 32 33 -34 35 36 37 - Exh 1 Exh 2 +