avarage market price per share of AMC in 2019 is 11, with total share outstanding of 103.82 million. Market to book equity of AMC in 2019 is?


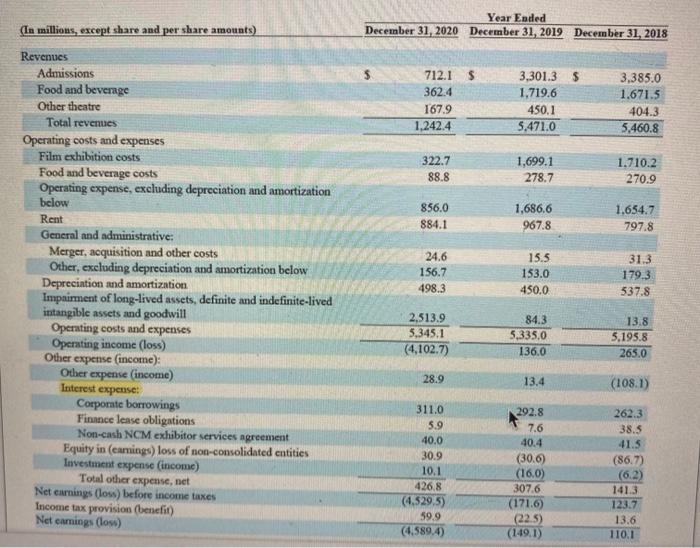
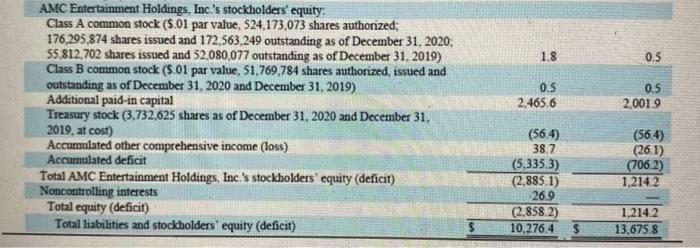
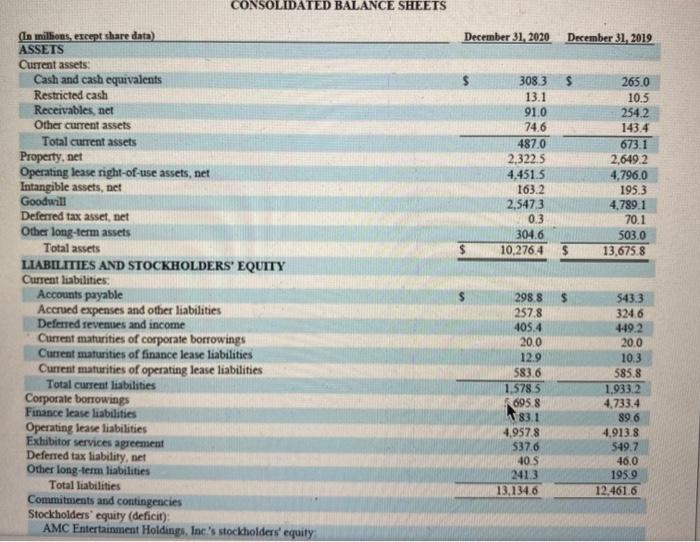
(In millions, except share and per share amounts) Year Ended December 31, 2020 December 31, 2019 December 31, 2018 712.1 $ 362.4 167.9 3,301.3 $ 1,719.6 450,1 5.471.0 3,385.0 1.671.5 404.3 5.460.8 1.242.4 322.7 88.8 1,699.1 278.7 1.710.2 270.9 856.0 884.1 1,686,6 967.8 1.654.7 797.8 Revenues Admissions Food and beverage Other theatre Total revenues Operating costs and expenses Film exhibition costs Food and beverage costs Operating expense, excluding depreciation and amortization below Rent General and administrative: Merger, acquisition and other costs Other, excluding depreciation and amortization below Depreciation and amortization Impairment of long-lived assets, definite and indefinite-lived intangible assets and goodwill Operating costs and expenses Operating income (loss) Other expense (income): Other expense (income) Interest expense: Corporate borrowings Finance lease obligations Non-cash NCM exhibitor services agreement Equity in (eamings) loss of non-consolidated entities Investment expense (income) Total other expense, net Net earnings (loss) before income taxes Income tax provision (benefit) Net camnings (los) 24.6 156.7 498.3 15.5 133.0 450.0 31.3 179.3 537.8 2,513.9 5.345.1 (4,102.7) 84.3 5,335.0 136.0 13.8 5.195.8 265.0 28.9 13.4 (1081) 311.0 5.9 40.0 30.9 10.1 426.8 (4.529,5) 59.9 (4.589.4) 292.8 7.6 40.4 (30.6) (16.0) 307.6 (1716) (22.5) (149.1) 262.3 38.5 41.5 (86.7) (62) 141.3 123.7 13.6 110.1 CONSOLIDATED BALANCE SHEETS December 31, 2020 December 31, 2019 308.3 13.1 91.0 74.6 487,0 2,3225 4,451.5 163.2 2,5473 0.3 304,6 10,276,4 265.0 10.5 254.2 143.4 673.1 2,649.2 4,796.0 195.3 4,789.1 70.1 5030 13,675.8 $ $ (La millions, except share data) ASSETS Current assets: Cash and cash equivalents Restricted cash Receivables, net Other current assets Total current assets Property, net Operating lease right-of-use assets, net Intangible assets, net Goodwill Deferred tax asset, net Other long-term assets Total assets LIABILITIES AND STOCKHOLDERS' EQUITY Current liabilities: Accounts payable Accrued expenses and other liabilities Deferred revenues and income Current matunities of corporate borrowings Current maturities of finance lease liabilities Current maturities of operating lease liabilities Total current liabilities Corporate borrowings Finance lease liabilities Operating lease liabilities Exhibitor services agreement Deferred tax liability, net Other long-term liabilities Total liabilities Commitments and contingencies Stockholders' equity (deficit) AMC Entertainment Holdings, Inc.'s stockholders' equity $ 298 8 2578 405.4 200 12.9 583.6 1.578 5 695.8 83.1 4,957.8 537.6 405 2413 13,134.6 5433 324.6 4492 20.0 10.3 585.8 1,933.2 4,733.4 89.6 4,913.8 549.7 46,0 1959 12.461.6 1.8 0.5 0.5 2,465.6 0.5 2,0019 AMC Entertainment Holdings, Inc.'s stockholders' equity: Class A common stock ($.01 par value, 524,173,073 shares authorized: 176,295,874 shares issued and 172,563.249 outstanding as of December 31, 2020: 55.812,702 shares issued and 52.080,077 outstanding as of December 31, 2019) Class B common stock (5.01 par value, 51,769,784 shares authorized, issued and outstanding as of December 31, 2020 and December 31, 2019) Additional paid-in capital Treasury stock (3.732,625 shares as of December 31, 2020 and December 31, 2019. at cost) Accumulated other comprehensive income (loss) Accumulated deficit Total AMC Entertainment Holdings, Inc.'s stockholders' equity (deficit) Noncontrolling interests Total equity (deficit) Total liabilities and stockholders' equity (deficit) (56.4) 38.7 (5.335.3) (2.885.1) 269 (2.858.2) 10,276.4 (56.4) (261) (706.2) 1,214.2 1,214.2 13,675.8


