Question
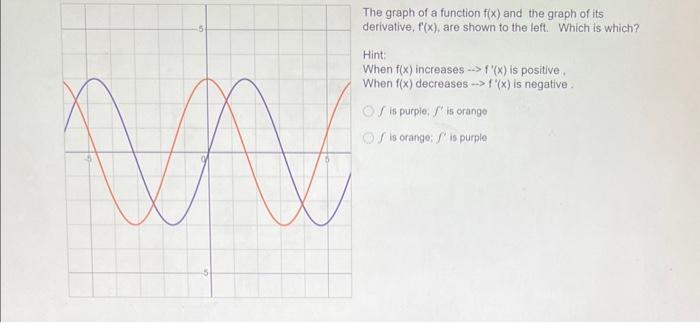
AVAV The graph of a function f(x) and the graph of its derivative, f'(x), are shown to the left. Which is which? Hint: When


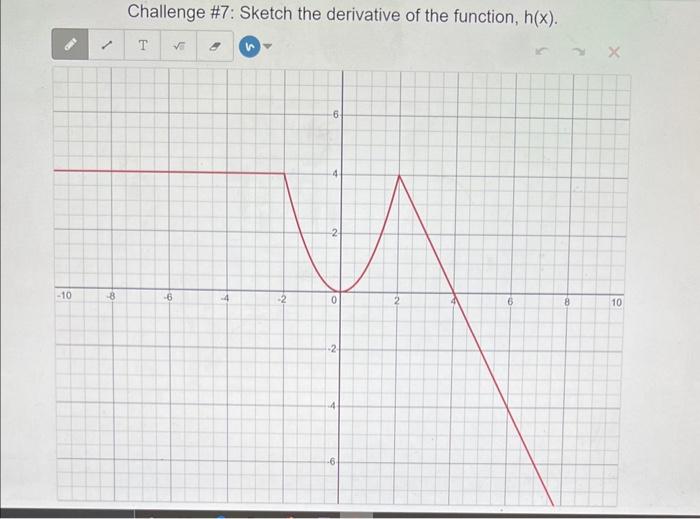
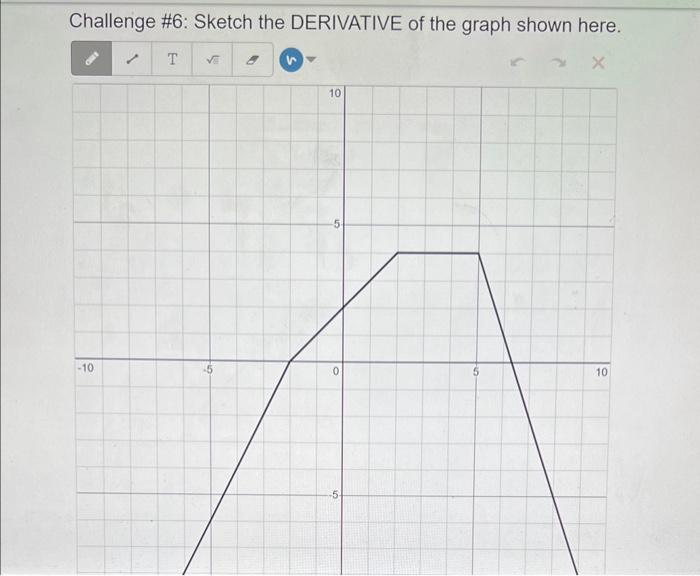
AVAV The graph of a function f(x) and the graph of its derivative, f'(x), are shown to the left. Which is which? Hint: When f(x) increases > f '(x) is positive. When f(x) decreases->f'(x) is negative. O is purple; /' is orange is orange; is purple -10 / -8 Challenge #7: Sketch the derivative of the function, h(x). T -6 8 54 -4 -2 6 2 0 -2 -6 2 6 8 10 Challenge #6: Sketch the DERIVATIVE of the graph shown here. -10 T 10 0 -5- 10
Step by Step Solution
3.39 Rating (152 Votes )
There are 3 Steps involved in it
Step: 1
Question Step 1 1 from given hint we can say that f9x has positive when Fx has to be inc...
Get Instant Access to Expert-Tailored Solutions
See step-by-step solutions with expert insights and AI powered tools for academic success
Step: 2

Step: 3

Ace Your Homework with AI
Get the answers you need in no time with our AI-driven, step-by-step assistance
Get StartedRecommended Textbook for
Calculus Early Transcendentals
Authors: James Stewart
7th edition
538497904, 978-0538497909
Students also viewed these Accounting questions
Question
Answered: 1 week ago
Question
Answered: 1 week ago
Question
Answered: 1 week ago
Question
Answered: 1 week ago
Question
Answered: 1 week ago
Question
Answered: 1 week ago
Question
Answered: 1 week ago
Question
Answered: 1 week ago
Question
Answered: 1 week ago
Question
Answered: 1 week ago
Question
Answered: 1 week ago
Question
Answered: 1 week ago
Question
Answered: 1 week ago
Question
Answered: 1 week ago
Question
Answered: 1 week ago
Question
Answered: 1 week ago
Question
Answered: 1 week ago
Question
Answered: 1 week ago
Question
Answered: 1 week ago
Question
Answered: 1 week ago
View Answer in SolutionInn App


