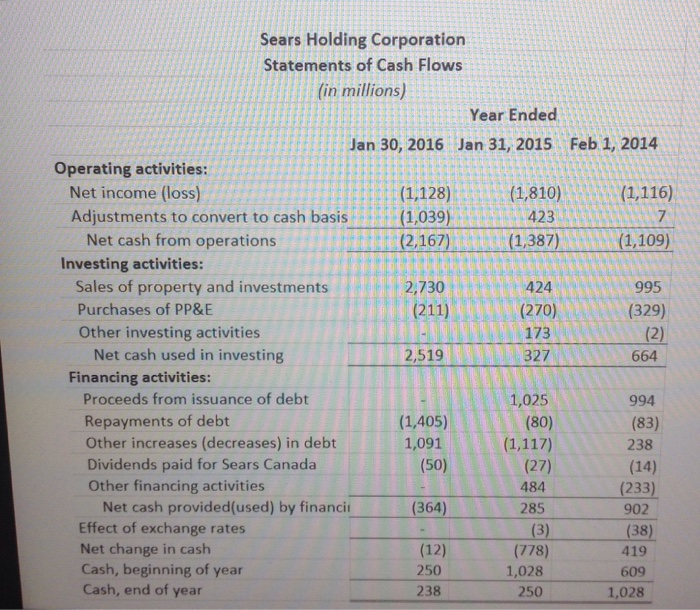
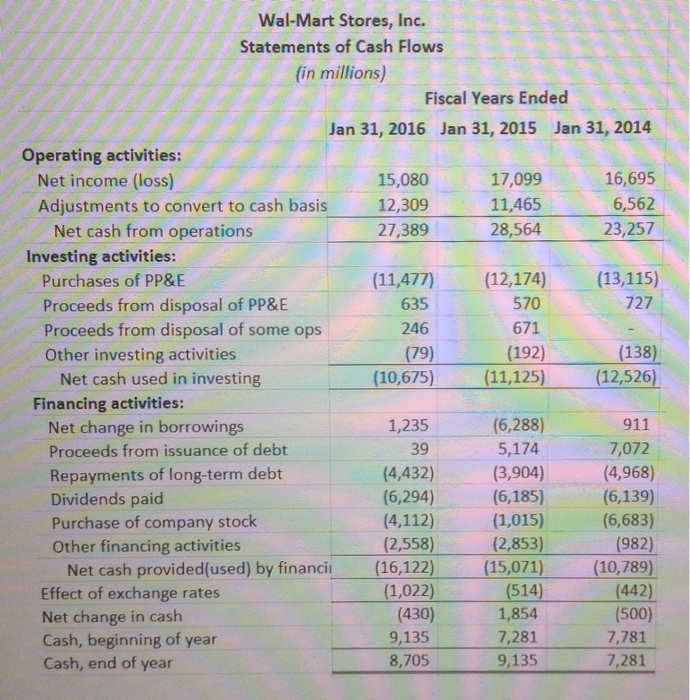
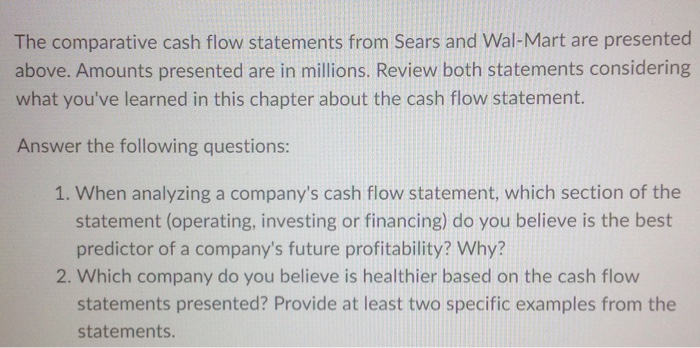
Az Sears Holding Corporation Statements of Cash Flows (in millions) Year Ended Jan 30, 2016 Jan 31, 2015 Feb 1, 2014 Operating activities: Net income (loss) (1,128) (1,810) (1,116) Adjustments to convert to cash basis (1,039) 423 Net cash from operations (2,167) NU (1,387) A (1,109) Investing activities: DEREN Sales of property and investments 2,730 4 24 9 95 Purchases of PP&E (211) M (270) (329) Other investing activities ENNE 173 (2) Net cash used in investing 2,519 327 664 Financing activities: Proceeds from issuance of debt 1,025 Repayments of debt (1,405) (80) (83) Other increases (decreases) in debt 1,091 (1,117) 238 Dividends paid for Sears Canada (50) (27) Other financing activities (233) Net cash provided(used) by financii (364) 285 902 Effect of exchange rates - (3) (3) (38) Net change in cash (12) (778) Cash, beginning of year 250 1,028 609 Cash, end of year 238 250 1,028 EST OS 994 (14) Wal-Mart Stores, Inc. Statements of Cash Flows (in millions) Fiscal Years Ended Jan 31, 2016 Jan 31, 2015 Jan 31, 2014 San Operating activities: Net income (loss) 15,080 17,099 16,695 Adjustments to convert to cash basis 12,309 11,465 6,562 Net cash from operations 27,389 28,564 23,257 Investing activities: Purchases of PP&E (11,477) (12,174) (13,115) Proceeds from disposal of PP&E 635 570 727 Proceeds from disposal of some ops 246 671 Other investing activities (79) (192) (138) Net cash used in investing (10,675) (11,125) (12,526) Financing activities: Net change in borrowings 1,235 (6,288) 911 Proceeds from issuance of debt 5,174 7,072 Repayments of long-term debt (4,432) (3,904) (4,968) Dividends paid (6,294) (6,185) (6,139) Purchase of company stock (4,112) (1,015) (6,683) Other financing activities (2,558) (2,853) Net cash provided(used) by financil (16,122) (15,071) (10,789) Effect of exchange rates (1,022) (514) (442) Net change in cash (430) 1,854 (500) Cash, beginning of year 9,135 7,281 7,781 Cash, end of year 8,705 9,135 7,281 39 (982) The comparative cash flow statements from Sears and Wal-Mart are presented above. Amounts presented are in millions. Review both statements considering what you've learned in this chapter about the cash flow statement. Answer the following questions: 1. When analyzing a company's cash flow statement, which section of the statement (operating, investing or financing) do you believe is the best predictor of a company's future profitability? Why? 2. Which company do you believe is healthier based on the cash flow statements presented? Provide at least two specific examples from the statements


