

Answered step by step
Verified Expert Solution
Question
1 Approved Answer
b 1a,b,c,d c. c. The graph shown right shows the concentration of cyclobutene as it decomposes over time at 1270K. i. Based on the graph,
b 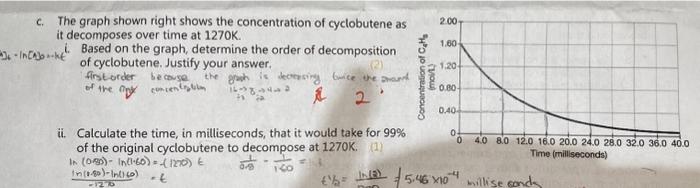
1a,b,c,d
c. The graph shown right shows the concentration of cyclobutene as it decomposes over time at 1270K. i. Based on the graph, determine the order of decomposition of cyclobutene. Justify your answer. firstorder becouse the groh is decresing buice the amant of the ofy contentsithm ii18i22 of ii. Calculate the time, in milliseconds, that it would take for 99% of the original cyclobutene to decompose at 1270K. in (0.20)ln(160)=(120)011 c.
Step by Step Solution
There are 3 Steps involved in it
Step: 1

Get Instant Access to Expert-Tailored Solutions
See step-by-step solutions with expert insights and AI powered tools for academic success
Step: 2

Step: 3
Ace Your Homework with AI
Get the answers you need in no time with our AI-driven, step-by-step assistance
Get Started
Understanding NMR Spectroscopy
Authors: James Keeler
2nd edition
470746084, 978-0470746097, 470746092, 978-0470746080