

Answered step by step
Verified Expert Solution
Question
1 Approved Answer
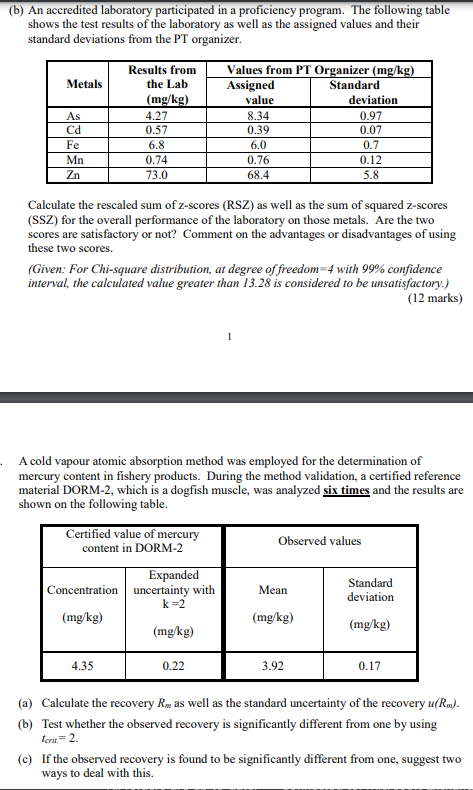
(b) An accredited laboratory participated in a proficiency program. The following table shows the test results of the laboratory as well as the assigned values
Step by Step Solution
There are 3 Steps involved in it
Step: 1

Get Instant Access to Expert-Tailored Solutions
See step-by-step solutions with expert insights and AI powered tools for academic success
Step: 2

Step: 3
Ace Your Homework with AI
Get the answers you need in no time with our AI-driven, step-by-step assistance
Get Started
Data Analysis And Signal Processing In Chromatography
Authors: A. Felinger
1st Edition
0444820663, 978-0444820662