B Announcements - MAT-240-H39 x B Grades - MAT-240-H3936 Applie X zy Section 7.1 - MAT 240: Applied St X Course Hero X + X
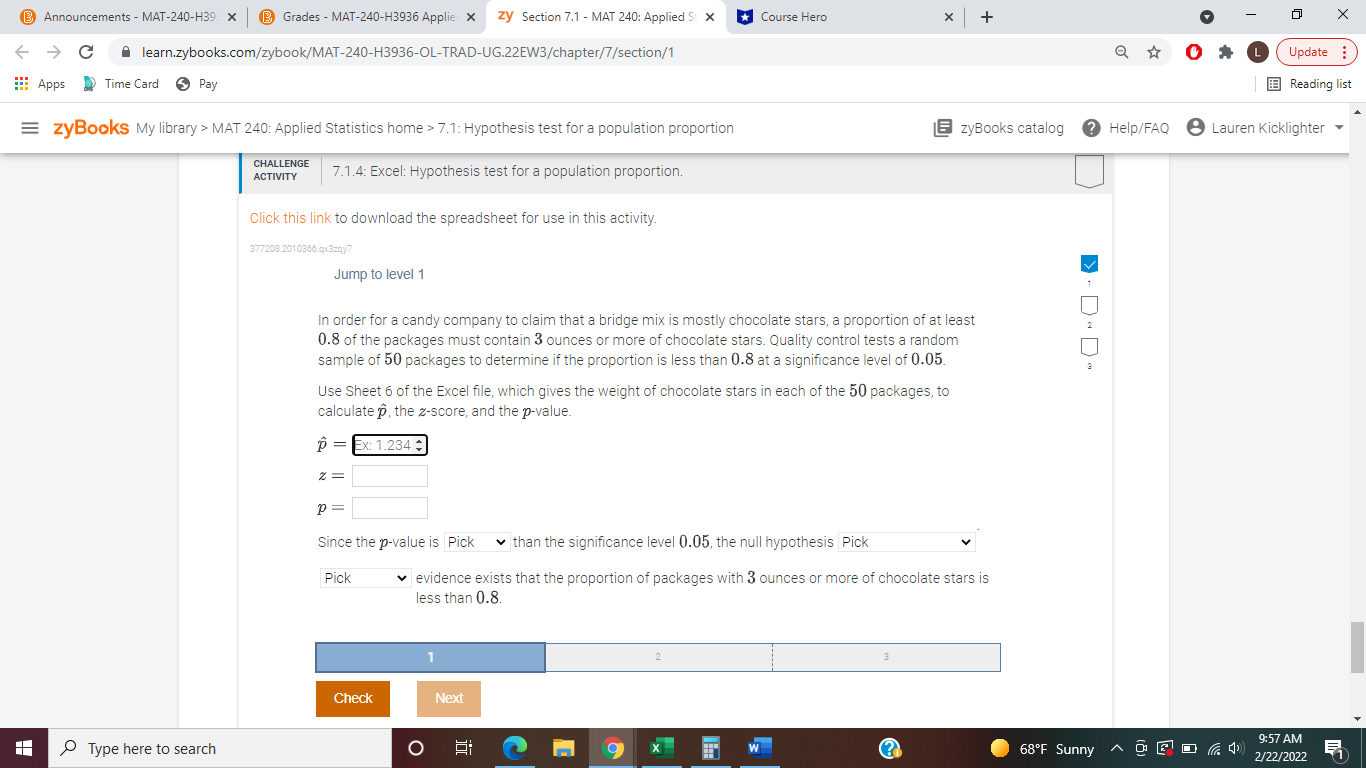
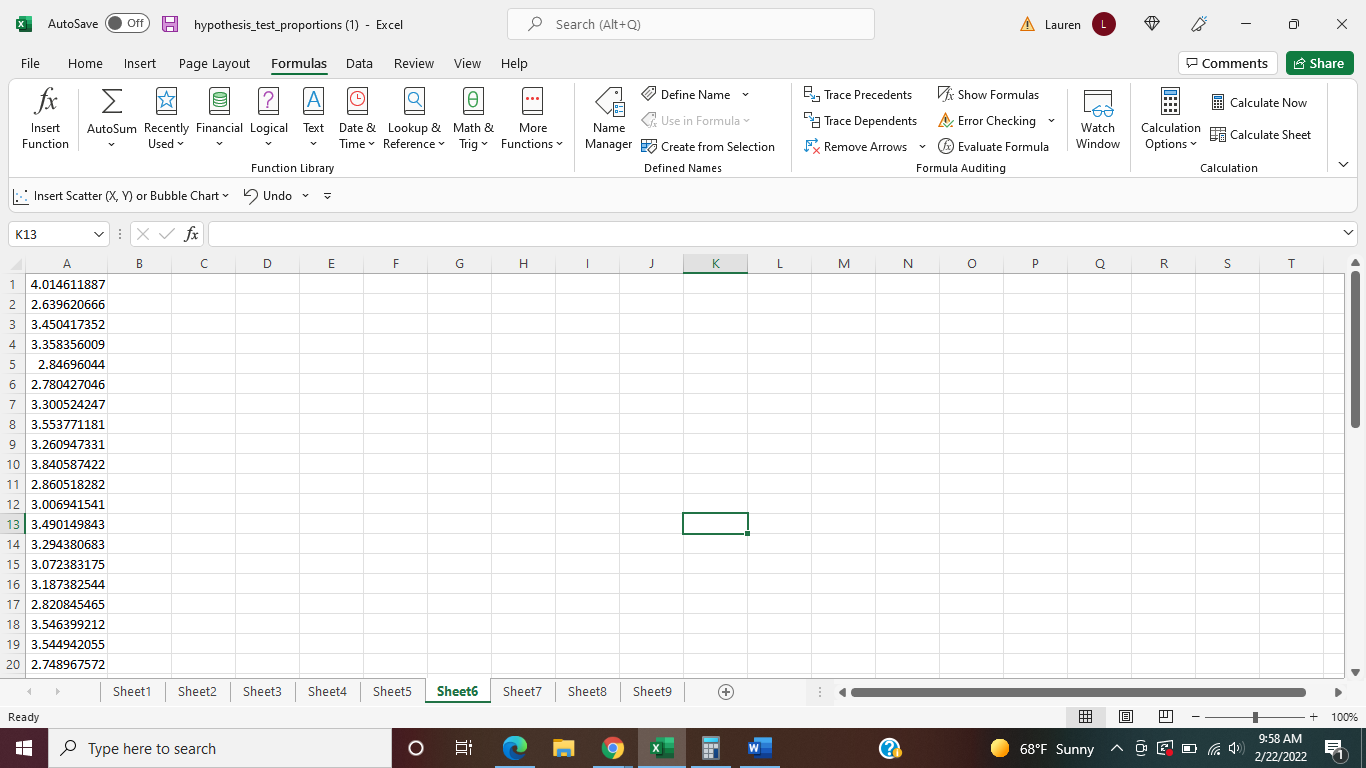
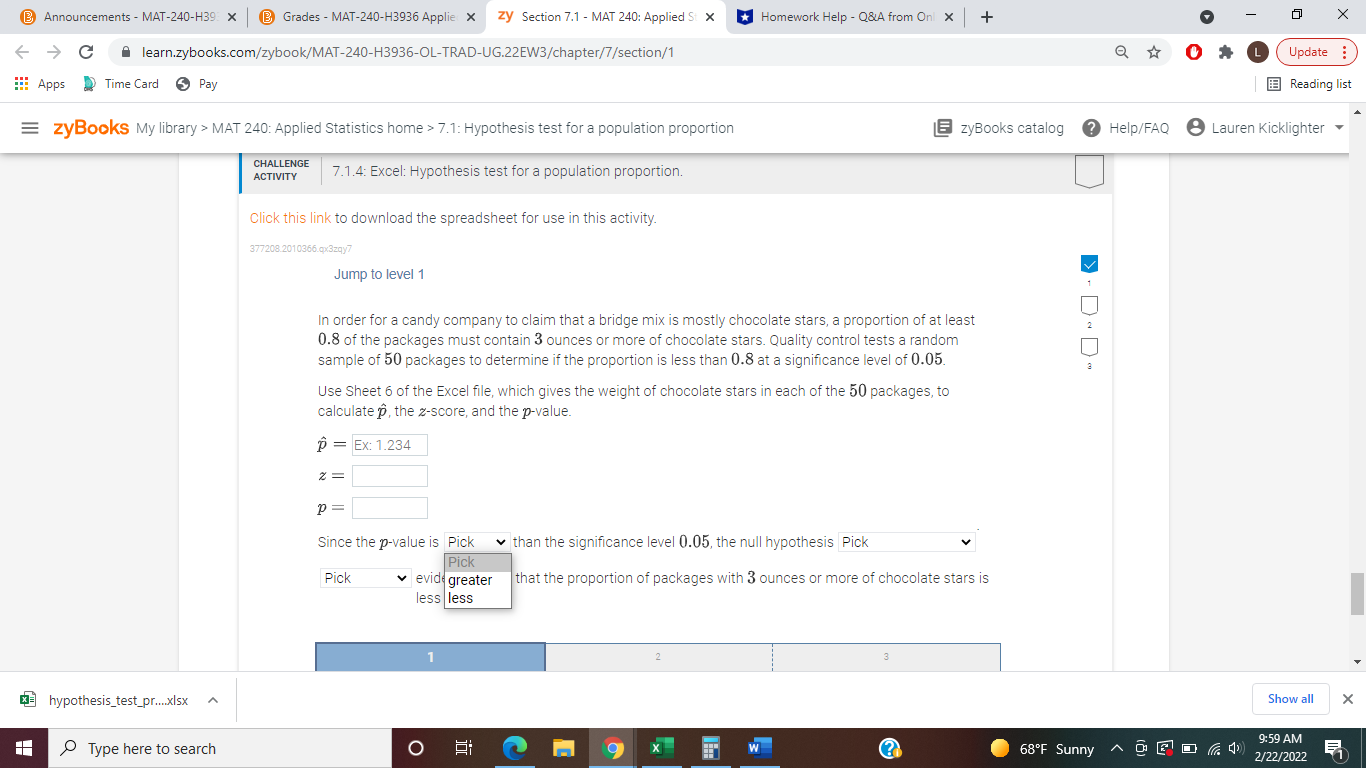
B Announcements - MAT-240-H39 x B Grades - MAT-240-H3936 Applie X zy Section 7.1 - MAT 240: Applied St X Course Hero X + X -) G learn.zybooks.com/zybook/MAT-240-H3936-OL-TRAD-UG.22EW3/chapter/7/section/1 Q Update Apps Time Card S Pay Reading list =zyBooks My library > MAT 240: Applied Statistics home > 7.1: Hypothesis test for a population proportion zyBooks catalog Help/FAQ & Lauren Kicklighter CHALLENGE ACTIVITY 7.1.4: Excel: Hypothesis test for a population proportion. Click this link to download the spreadsheet for use in this activity. 377208.2010366.qx3zqy7 Jump to level 1 In order for a candy company to claim that a bridge mix is mostly chocolate stars, a proportion of at least 0.8 of the packages must contain 3 ounces or more of chocolate stars. Quality control tests a random sample of 50 packages to determine if the proportion is less than 0.8 at a significance level of 0.05. Use Sheet 6 of the Excel file, which gives the weight of chocolate stars in each of the 50 packages, to calculate p, the z-score, and the p-value. p = Ex: 1.234 + Z = p = Since the p-value is Pick * than the significance level 0.05, the null hypothesis Pick Pick evidence exists that the proportion of packages with 3 ounces or more of chocolate stars is less than 0.8. 1 2 3 Check Next Type here to search O 9 X W O 9:57 AM 68'F Sunny ^ 9 @ D (() 2/22/2022X AutoSave @ Off hypothesis_test_proportions (1) - Excel Search (Alt+Q) A Lauren X File Home Insert Page Layout Formulas Data Review View Help Comments Share fx A e Define Name By Trace Precedents Vix Show Formulas Calculate Now Insert AutoSum Recently Financial Logical t Date & Lookup & Math & More Name Use in Formula By Trace Dependents Error Checking Watch Calculation Calculate Sheet Function Used * Time Reference Trig Functions Manager Create from Selection Ex Remove Arrows & Evaluate Formula Window Options Function Library Defined Names Formula Auditing Calculation B: Insert Scatter (X, V) or Bubble Chart * ) Undo * = K13 A B C D E F G H K L M N O P Q R S T 4.014611887 2.639620666 W N 3.450417352 3.358356009 2.84696044 2.780427046 3.300524247 3.553771181 9 3.260947331 10 3.840587422 11 2.860518282 12 3.006941541 13 3.490149843 14 3.294380683 15 3.072383175 16 3.187382544 17 2.820845465 18 3.546399212 19 3.544942055 20 2.748967572 Sheet1 Sheet2 Sheet3 Sheet4 Sheet5 Sheet6 Sheet7 Sheets Sheet9 + Ready + 100% 9:58 AM Type here to search O W 68'F Sunny ~ 9 @ D (() 2/22/2022B Announcements - MAT-240-H39 x B Grades - MAT-240-H3936 Applie X zy Section 7.1 - MAT 240: Applied St X Homework Help - Q&A from Onl x + X -) G learn.zybooks.com/zybook/MAT-240-H3936-OL-TRAD-UG.22EW3/chapter/7/section/1 Q Update Apps Time Card S Pay Reading list =zyBooks My library > MAT 240: Applied Statistics home > 7.1: Hypothesis test for a population proportion zyBooks catalog Help/FAQ & Lauren Kicklighter CHALLENGE ACTIVITY 7.1.4: Excel: Hypothesis test for a population proportion. Click this link to download the spreadsheet for use in this activity. 377208.2010366.qx3zqy7 Jump to level 1 In order for a candy company to claim that a bridge mix is mostly chocolate stars, a proportion of at least 0.8 of the packages must contain 3 ounces or more of chocolate stars. Quality control tests a random sample of 50 packages to determine if the proportion is less than 0.8 at a significance level of 0.05. Use Sheet 6 of the Excel file, which gives the weight of chocolate stars in each of the 50 packages, to calculate p, the z-score, and the p-value. P = Ex: 1.234 2 = p = Since the p-value is Pick v than the significance level 0.05, the null hypothesis Pick Pick Pick v evide greater that the proportion of packages with 3 ounces or more of chocolate stars is less less 1 2 3 = hypothesis_test_pr...xlsx Show all X Type here to search O 9 X W 9:59 AM 68'F Sunny ^ 9 ( D () 2/22/2022B Announcements - MAT-240-H39 x B Grades - MAT-240-H3936 Applie X zy Section 7.1 - MAT 240: Applied St X Homework Help - Q&A from Onl x + X -) G learn.zybooks.com/zybook/MAT-240-H3936-OL-TRAD-UG.22EW3/chapter/7/section/1 Q Update Apps Time Card S Pay Reading list =zyBooks My library > MAT 240: Applied Statistics home > 7.1: Hypothesis test for a population proportion zyBooks catalog Help/FAQ & Lauren Kicklighter CHALLENGE ACTIVITY 7.1.4: Excel: Hypothesis test for a population proportion. Click this link to download the spreadsheet for use in this activity. 377208.2010366.qx3zqy7 Jump to level 1 In order for a candy company to claim that a bridge mix is mostly chocolate stars, a proportion of at least 0.8 of the packages must contain 3 ounces or more of chocolate stars. Quality control tests a random sample of 50 packages to determine if the proportion is less than 0.8 at a significance level of 0.05. Use Sheet 6 of the Excel file, which gives the weight of chocolate stars in each of the 50 packages, to calculate p, the z-score, and the p-value. P = Ex: 1.234 2 = p = Since the p-value is Pick * than the significance level 0.05, the null hypothesis Pick Pick Pick evidence exists that the proportion of packages with 3 ounces or m fails to be rejected is less than 0.8. is rejected 1 2 3 = hypothesis_test_pr...xlsx Show all X Type here to search O 9 X W O 9:59 AM 68'F Sunny ^ 9 @ D () 2/22/2022B Announcements - MAT-240-H39 x B Grades - MAT-240-H3936 Applie X zy Section 7.1 - MAT 240: Applied St X Homework Help - Q&A from Onl x + X -) G learn.zybooks.com/zybook/MAT-240-H3936-OL-TRAD-UG.22EW3/chapter/7/section/1 Q Update Apps Time Card S Pay Reading list =zyBooks My library > MAT 240: Applied Statistics home > 7.1: Hypothesis test for a population proportion zyBooks catalog Help/FAQ & Lauren Kicklighter CHALLENGE ACTIVITY 7.1.4: Excel: Hypothesis test for a population proportion. Click this link to download the spreadsheet for use in this activity. 377208.2010366.qx3zqy7 Jump to level 1 In order for a candy company to claim that a bridge mix is mostly chocolate stars, a proportion of at least 0.8 of the packages must contain 3 ounces or more of chocolate stars. Quality control tests a random sample of 50 packages to determine if the proportion is less than 0.8 at a significance level of 0.05. Use Sheet 6 of the Excel file, which gives the weight of chocolate stars in each of the 50 packages, to calculate p, the z-score, and the p-value. P = Ex: 1.234 2 = p = Since the p-value is Pick * than the significance level 0.05, the null hypothesis Pick Pick evidence exists that the proportion of packages with 3 ounces or more of chocolate stars is Pick ess than 0.8. Sufficient Insufficient 1 2 3 = hypothesis_test_pr..xIsx Show all X W 9:59 AM Type here to search O 9 X 68'F Sunny ^ 9 ( D () 2/22/2022X AutoSave @ Off hypothesis_test_proportions (1) - Excel Search (Alt+Q) A Lauren X File Home Insert Page Layout Formulas Data Review View Help Comments Share fx A e Define Name By Trace Precedents Vix Show Formulas Calculate Now Insert AutoSum Recently Financial Logical t Date & Lookup & Math & More Name Use in Formula By Trace Dependents Error Checking Watch Calculation Calculate Sheet Function Used * Time Reference Trig Functions Manager Create from Selection Ex Remove Arrows & Evaluate Formula Window Options Function Library Defined Names Formula Auditing Calculation B: Insert Scatter (X, V) or Bubble Chart * K) Undo v K13 viXA A B C D E F G H K L M N O P Q R S T 21 2.652408184 22 4.197403054 23 3.796142284 24 2.955329372 25 3.778144874 26 3.168328778 27 3.270480732 28 3.614530416 29 2.927848759 30 2.850946925 31 3.667463595 32 3.365819029 33 3.745560137 34 2.468050886 35 2.555468467 36 3.992926305 37 2.746529761 38 3.888628615 39 3.146799747 40 3.717876484 Sheet1 Sheet2 Sheet3 Sheet4 Sheet5 Sheet6 Sheet7 Sheets Sheet9 (+ 1 Ready + 100% 9:59 AM Type here to search O W 68'F Sunny ~ 9 @ D (() 2/22/2022X AutoSave @ Off hypothesis_test_proportions (1) - Excel Search (Alt+Q) A Lauren X File Home Insert Page Layout Formulas Data Review View Help Comments Share fx A e Define Name By Trace Precedents Vix Show Formulas Calculate Now t Date & Lookup & Math & More Name Use in Formula By Trace Dependents Error Checking Insert AutoSum Recently Financial Logical Watch Calculation Calculate Sheet Function Used * Time Reference Trig Functions Manager Create from Selection Ex Remove Arrows * 4 Evaluate Formula Window Options Function Library Defined Names Formula Auditing Calculation B: Insert Scatter (X, V) or Bubble Chart * ) Undo v B60 vix fx A B C D E F G H K L M N O P Q R S T 41 2.963146132 42 4.062453601 43 2.957488418 44 3.088456806 45 3.220619188 46 2.732202622 47 2.279175658 48 2.565911123 49 2.884354933 50 2.702268277 51 52 53 54 55 56 57 58 59 60 Sheet1 Sheet2 Sheet3 Sheet4 Sheet5 Sheet6 Sheet7 Sheets Sheet9 (+ 1 Ready + 100% 10:00 AM Type here to search O W 68'F Sunny ^ 9 @ D () 2/22/2022
Step by Step Solution
There are 3 Steps involved in it
Step: 1
Get Instant Access to Expert-Tailored Solutions
See step-by-step solutions with expert insights and AI powered tools for academic success
Step: 2
Step: 3
Ace Your Homework with AI
Get the answers you need in no time with our AI-driven, step-by-step assistance