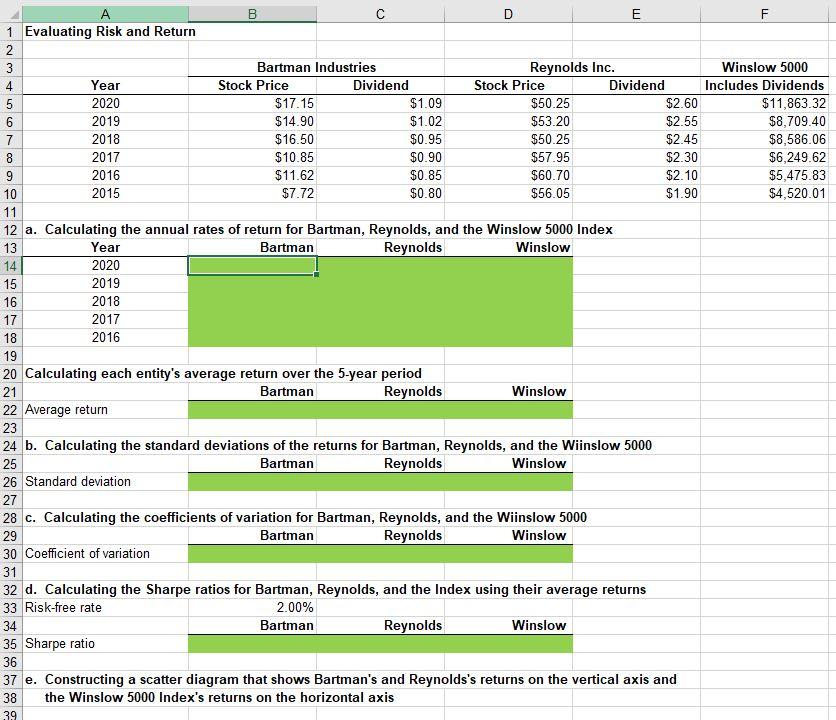
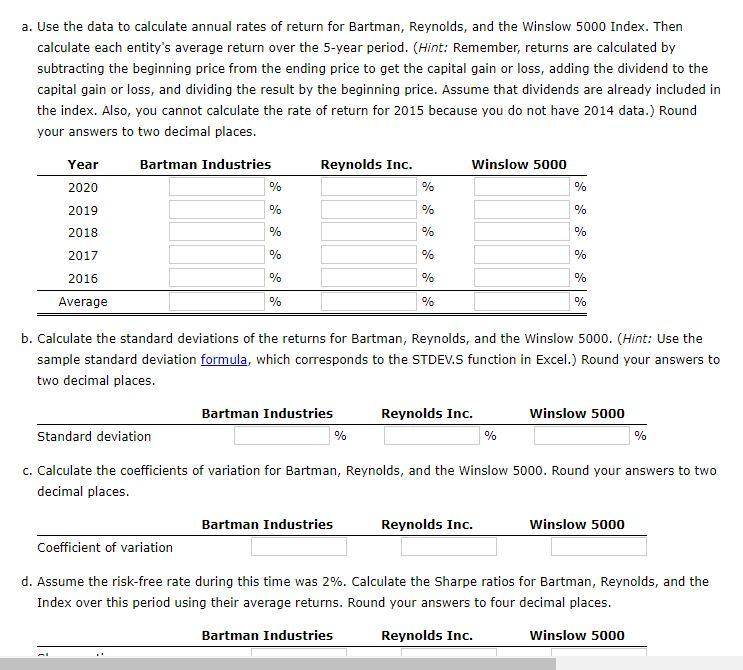
B C D E F 1 Evaluating Risk and Return Winslow 5000 Includes Dividends $11,863.32 $8,709.40 $8,586.06 $6,249.62 $5,475.83 $4,520.01 NOGNONNSUNDO WN Bartman Industries Reynolds Inc. Year Stock Price Dividend Stock Price Dividend 2020 $17.15 $1.09 $50.25 $2.60 2019 $14.90 $1.02 $53.20 $2.55 2018 $16.50 $0.95 $50.25 $2.45 2017 $10.85 $0.90 $57.95 $2.30 2016 $11.62 $0.85 $60.70 $2.10 10 2015 $7.72 $0.80 $56.05 $1.90 11 12 a. Calculating the annual rates of return for Bartman, Reynolds, and the Winslow 5000 Index 13 Year Bartman Reynolds Winslow 14 2020 15 2019 16 2018 17 2017 18 2016 19 20 Calculating each entity's average return over the 5-year period 21 Bartman Reynolds Winslow 22 Average return 23 24 b. Calculating the standard deviations of the returns for Bartman, Reynolds, and the Wiinslow 5000 25 Bartman Reynolds Winslow 26 Standard deviation 27 28 c. Calculating the coefficients of variation for Bartman, Reynolds, and the Wiinslow 5000 29 Bartman Reynolds Winslow 30 Coefficient of variation 31 32 d. Calculating the Sharpe ratios for Bartman, Reynolds, and the Index using their average returns 33 Risk-free rate 2.00% 34 Bartman Reynolds Winslow 35 Sharpe ratio 36 37 e. Constructing a scatter diagram that shows Bartman's and Reynolds's returns on the vertical axis and 38 the Winslow 5000 Index's returns on the horizontal axis 39 a. Use the data to calculate annual rates of return for Bartman, Reynolds, and the Winslow 5000 Index. Then calculate each entity's average return over the 5-year period. (Hint: Remember, returns are calculated by subtracting the beginning price from the ending price to get the capital gain or loss, adding the dividend to the capital gain or loss, and dividing the result by the beginning price. Assume that dividends are already included in the index. Also, you cannot calculate the rate of return for 2015 because you do not have 2014 data.) Round your answers to two decimal places. Year Bartman Industries Reynolds Inc. Winslow 5000 2020 % % % % 2019 % % 2018 % % % 2017 % % % % % % 2016 Average % % % b. Calculate the standard deviations of the returns for Bartman, Reynolds, and the Winslow 5000. (Hint: Use the sample standard deviation formula, which corresponds to the STDEV.S function in Excel.) Round your answers to two decimal places. Bartman Industries % Reynolds Inc. Winslow 5000 Standard deviation % % c. Calculate the coefficients of variation for Bartman, Reynolds, and the Winslow 5000. Round your answers to two decimal places. Bartman Industries Reynolds Inc. Winslow 5000 Coefficient of variation d. Assume the risk-free rate during this time was 2%. Calculate the Sharpe ratios for Bartman, Reynolds, and the Index over this period using their average returns. Round your answers to four decimal places. Bartman Industries Reynolds Inc. Winslow 5000 B C D E F 1 Evaluating Risk and Return Winslow 5000 Includes Dividends $11,863.32 $8,709.40 $8,586.06 $6,249.62 $5,475.83 $4,520.01 NOGNONNSUNDO WN Bartman Industries Reynolds Inc. Year Stock Price Dividend Stock Price Dividend 2020 $17.15 $1.09 $50.25 $2.60 2019 $14.90 $1.02 $53.20 $2.55 2018 $16.50 $0.95 $50.25 $2.45 2017 $10.85 $0.90 $57.95 $2.30 2016 $11.62 $0.85 $60.70 $2.10 10 2015 $7.72 $0.80 $56.05 $1.90 11 12 a. Calculating the annual rates of return for Bartman, Reynolds, and the Winslow 5000 Index 13 Year Bartman Reynolds Winslow 14 2020 15 2019 16 2018 17 2017 18 2016 19 20 Calculating each entity's average return over the 5-year period 21 Bartman Reynolds Winslow 22 Average return 23 24 b. Calculating the standard deviations of the returns for Bartman, Reynolds, and the Wiinslow 5000 25 Bartman Reynolds Winslow 26 Standard deviation 27 28 c. Calculating the coefficients of variation for Bartman, Reynolds, and the Wiinslow 5000 29 Bartman Reynolds Winslow 30 Coefficient of variation 31 32 d. Calculating the Sharpe ratios for Bartman, Reynolds, and the Index using their average returns 33 Risk-free rate 2.00% 34 Bartman Reynolds Winslow 35 Sharpe ratio 36 37 e. Constructing a scatter diagram that shows Bartman's and Reynolds's returns on the vertical axis and 38 the Winslow 5000 Index's returns on the horizontal axis 39 a. Use the data to calculate annual rates of return for Bartman, Reynolds, and the Winslow 5000 Index. Then calculate each entity's average return over the 5-year period. (Hint: Remember, returns are calculated by subtracting the beginning price from the ending price to get the capital gain or loss, adding the dividend to the capital gain or loss, and dividing the result by the beginning price. Assume that dividends are already included in the index. Also, you cannot calculate the rate of return for 2015 because you do not have 2014 data.) Round your answers to two decimal places. Year Bartman Industries Reynolds Inc. Winslow 5000 2020 % % % % 2019 % % 2018 % % % 2017 % % % % % % 2016 Average % % % b. Calculate the standard deviations of the returns for Bartman, Reynolds, and the Winslow 5000. (Hint: Use the sample standard deviation formula, which corresponds to the STDEV.S function in Excel.) Round your answers to two decimal places. Bartman Industries % Reynolds Inc. Winslow 5000 Standard deviation % % c. Calculate the coefficients of variation for Bartman, Reynolds, and the Winslow 5000. Round your answers to two decimal places. Bartman Industries Reynolds Inc. Winslow 5000 Coefficient of variation d. Assume the risk-free rate during this time was 2%. Calculate the Sharpe ratios for Bartman, Reynolds, and the Index over this period using their average returns. Round your answers to four decimal places. Bartman Industries Reynolds Inc. Winslow 5000