Answered step by step
Verified Expert Solution
Question
1 Approved Answer
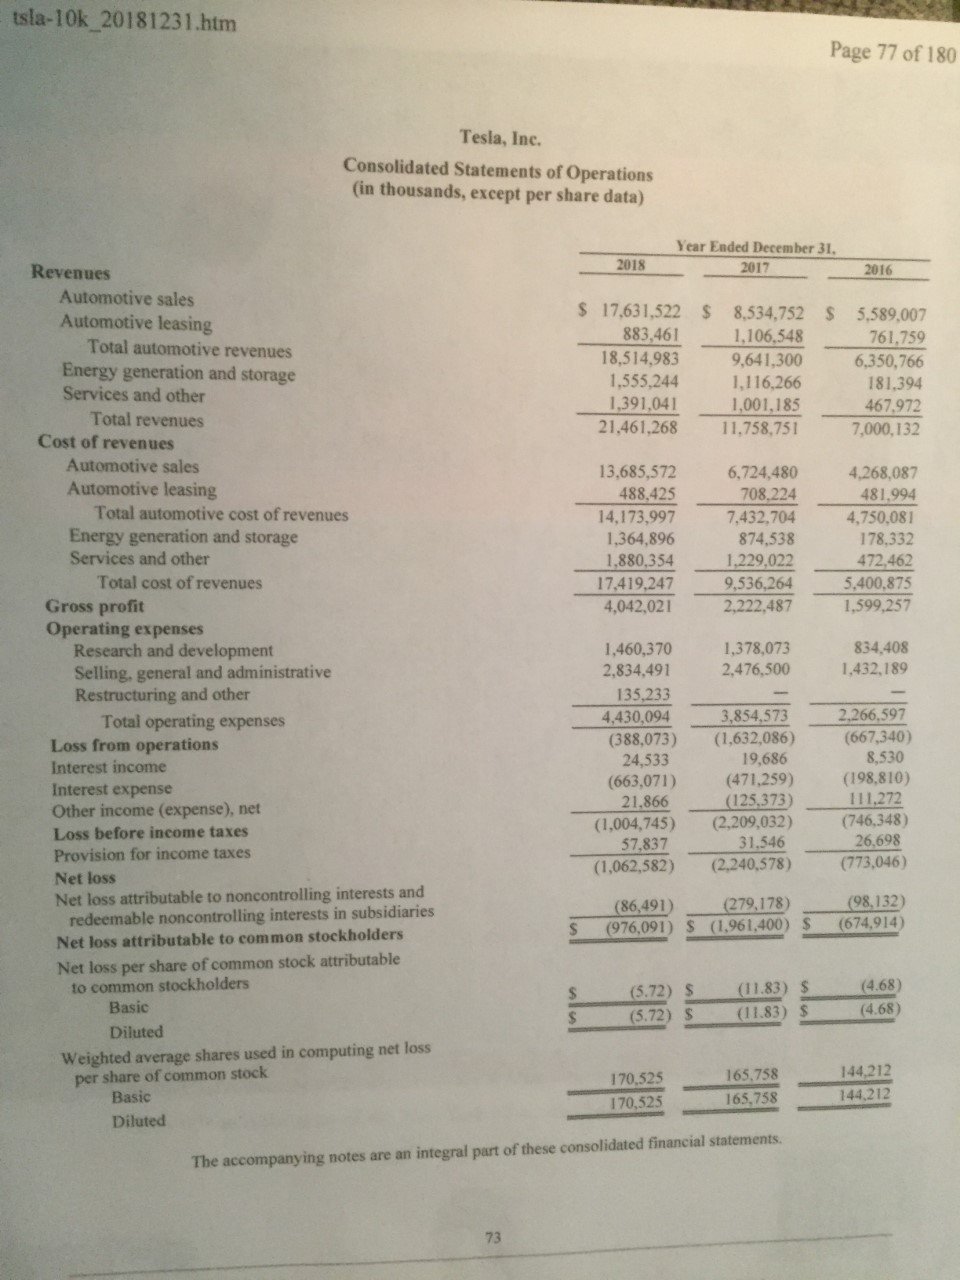
b.) Calculate the following ratios for each of the three years presented: Gross Profit (2018) _________ (2017)__________ (2016) _________ Ratio of operating expenses to sales

b.) Calculate the following ratios for each of the three years presented:
Gross Profit (2018) _________ (2017)__________ (2016) _________
Ratio of operating expenses to sales (or operating revenue) (%) (2018) _________ (2017)__________ (2016) _________
Profit Margin (%) Net income/sales or operating revenues (2018) _________ (2017)__________ (2016) _________
Return on assets Net income/average total assets (2018) _________ (2017)__________ (2016) _________
tsla-10k 20181231.htm Page 77 of 180 Tesla, Inc. Consolidated Statements of Operations (in thousands, except per share data) Year Ended December 31, 2017 2018 2016 $ $ $ 17,631,522 883,461 18,514,983 1,555,244 1,391,041 21,461,268 8,534,752 1,106,548 9,641,300 1,116,266 1,001,185 11,758,751 5,589,007 761,759 6,350,766 181,394 467.972 7,000,132 13,685,572 488,425 14,173,997 1,364,896 1,880,354 17,419,247 4,042,021 6,724,480 708,224 7,432,704 874,538 1,229,022 9,536,264 2,222,487 4.268,087 481,994 4,750.081 178.332 472,462 5,400,875 1.599,257 1,378,073 2,476,500 834,408 1,432,189 Revenues Automotive sales Automotive leasing Total automotive revenues Energy generation and storage Services and other Total revenues Cost of revenues Automotive sales Automotive leasing Total automotive cost of revenues Energy generation and storage Services and other Total cost of revenues Gross profit Operating expenses Research and development Selling, general and administrative Restructuring and other Total operating expenses Loss from operations Interest income Interest expense Other income (expense), net Loss before income taxes Provision for income taxes Net loss Net loss attributable to noncontrolling interests and redeemable noncontrolling interests in subsidiaries Net loss attributable to common stockholders Net loss per share of common stock attributable to common stockholders Basic Diluted Weighted average shares used in computing net loss per share of common stock Basic Diluted 1,460,370 2,834,491 135,233 4,430,094 (388,073) 24,533 (663,071) 21.866 (1,004,745) 57,837 (1,062,582) 3,854,573 (1.632,086) 19,686 (471,259) (125,373) (2,209,032) 31.546 (2,240,578) 2.266,597 (667,340) 8,530 (198.810) 111,272 (746,348) 26,698 (773,046) (86,491) (976,091) S (279,178) (98,132) (674,914) $ (1,961,400) (5.72) $ (5.72) S (11.83) $ (11.83) $ (4.68) (4.68) 170,525 170,525 165,758 165,758 144,212 144,212 The accompanying notes are an integral part of these consolidated financial statementsStep by Step Solution
There are 3 Steps involved in it
Step: 1

Get Instant Access to Expert-Tailored Solutions
See step-by-step solutions with expert insights and AI powered tools for academic success
Step: 2

Step: 3

Ace Your Homework with AI
Get the answers you need in no time with our AI-driven, step-by-step assistance
Get Started


