

Answered step by step
Verified Expert Solution
Question
1 Approved Answer
B column head to the right ( 2 ) Create an Ordinal Scale On the output page, examine the minimum and maximum values, as well
B column head
to the right
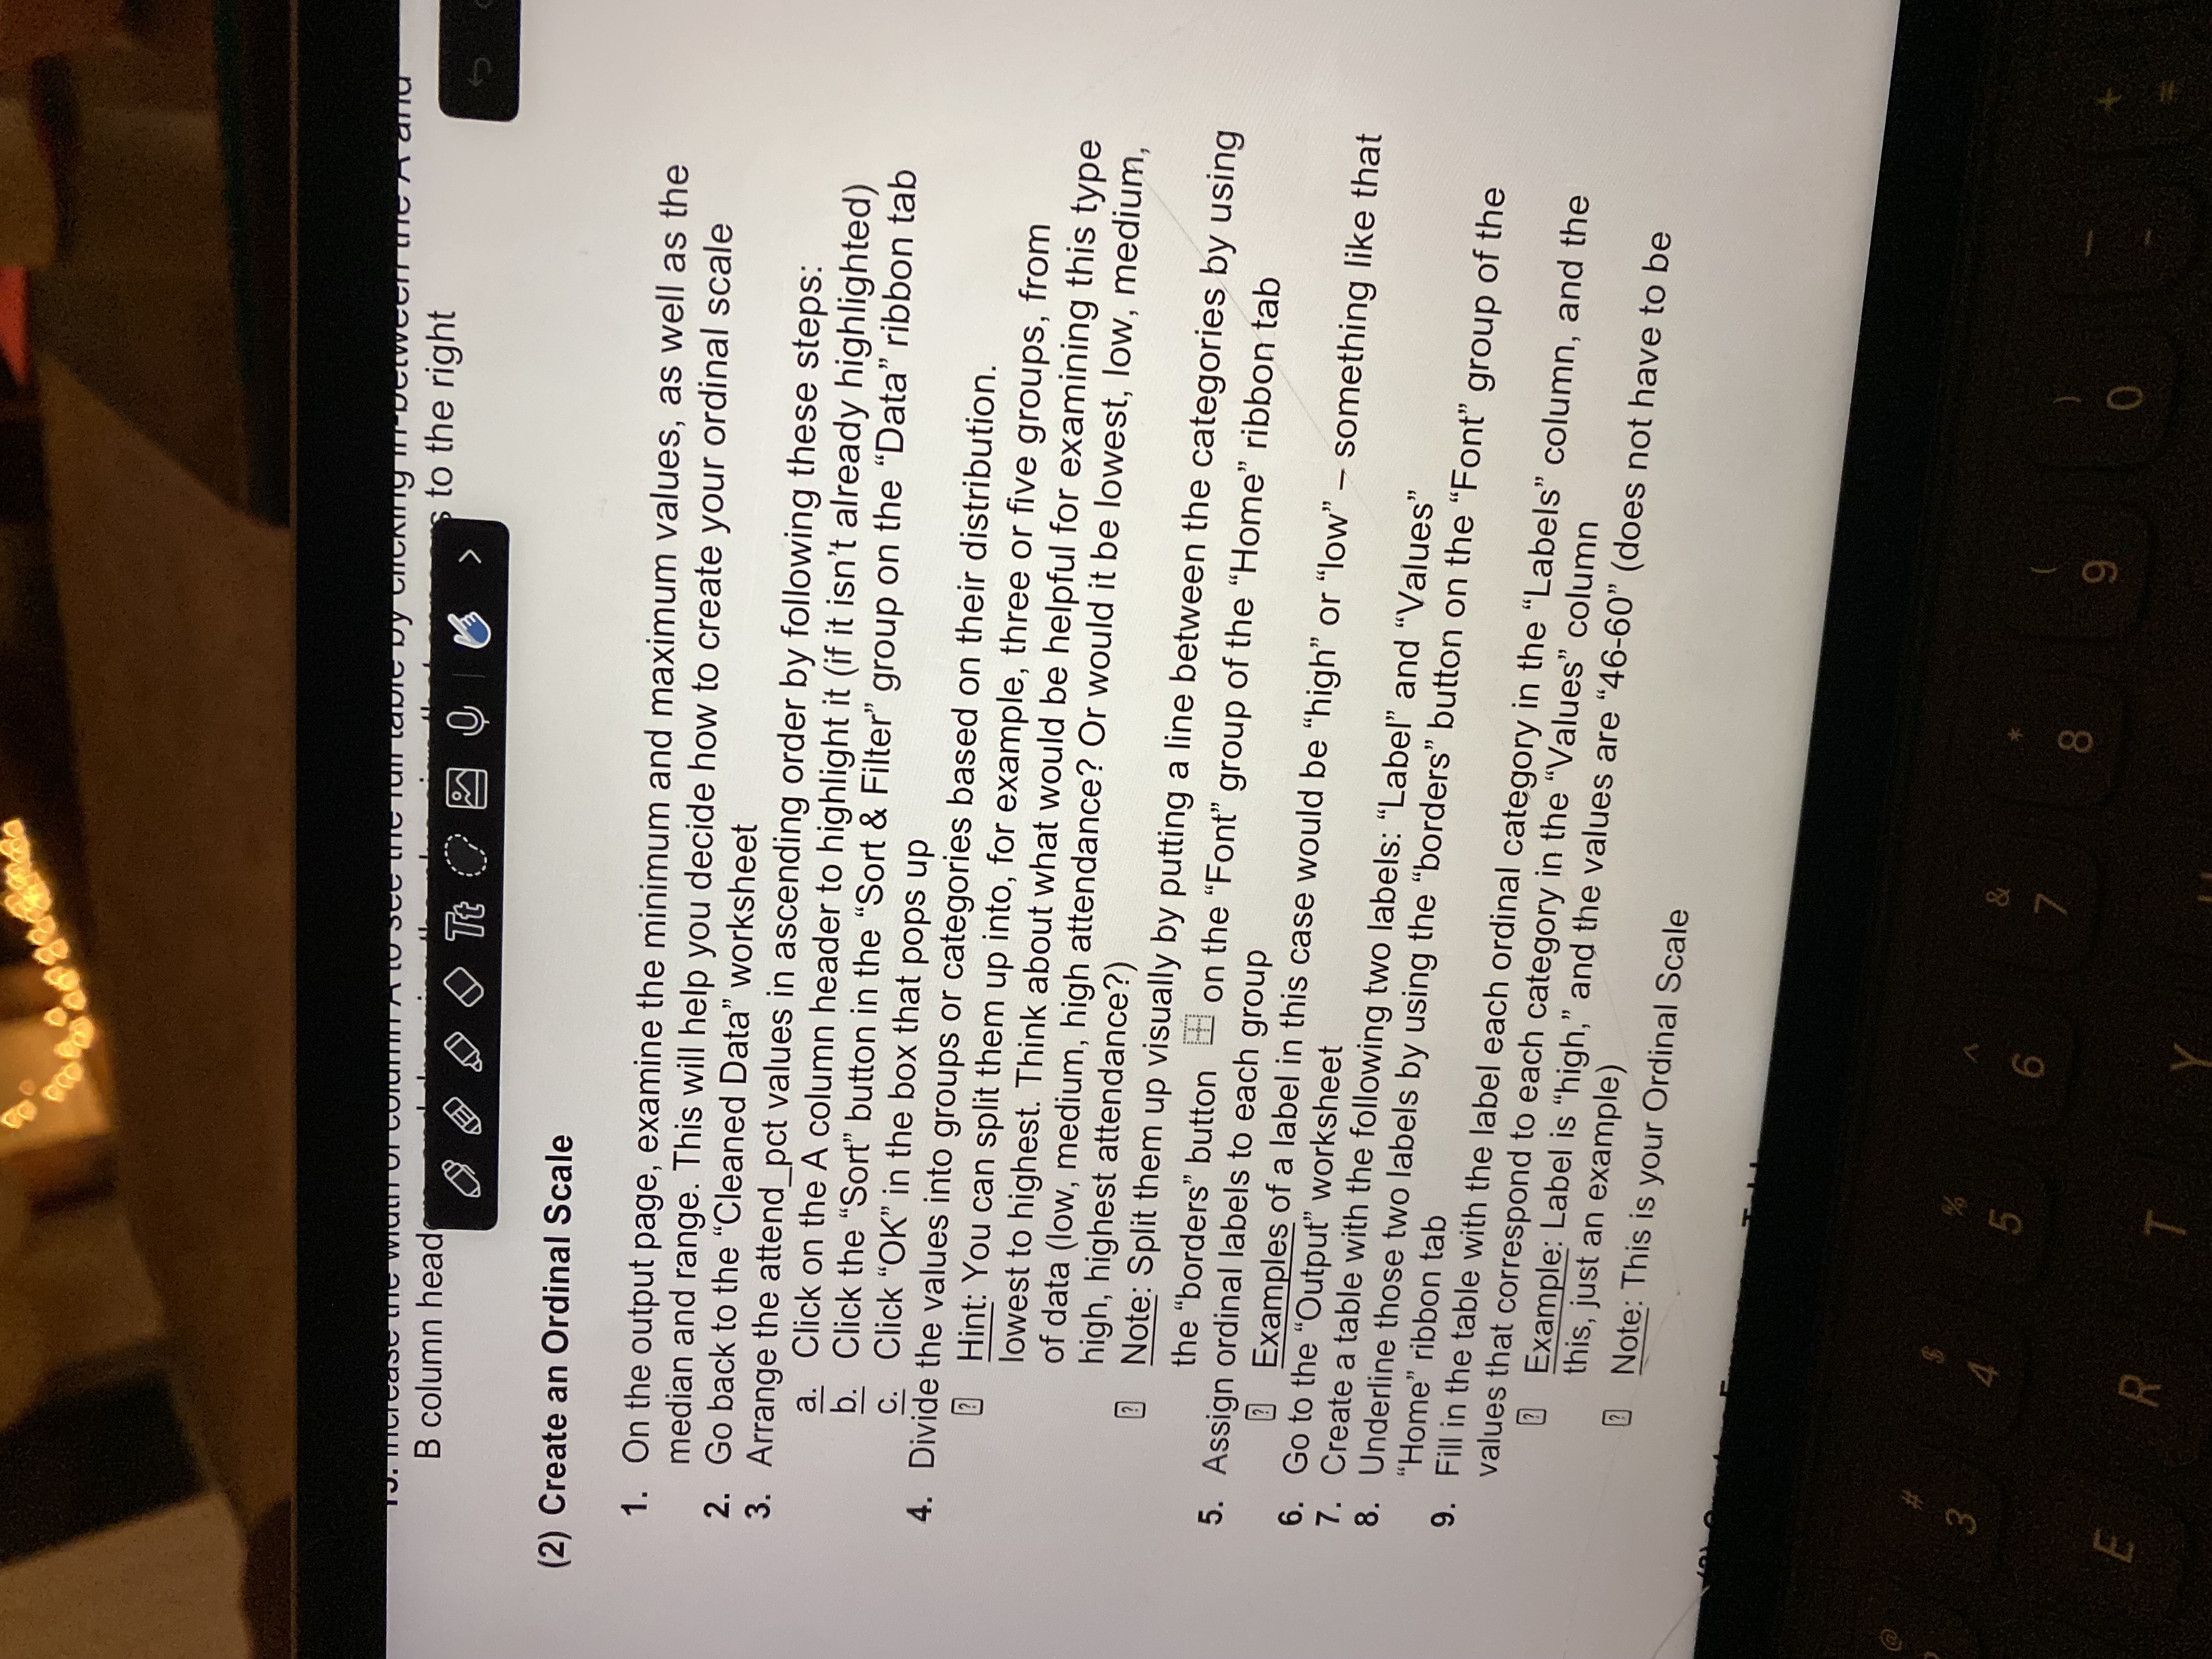
Create an Ordinal Scale
On the output page, examine the minimum and maximum values, as well as the median and range. This will help you decide how to create your ordinal scale
Go back to the "Cleaned Data" worksheet
Arrange the attendpct values in ascending order by following these steps:
a Click on the A column header to highlight it if it isn't already highlighted
b Click the "Sort" button in the "Sort & Filter" group on the "Data" ribbon tab
c Click OK in the box that pops up
Divide the values into groups or categories based on their distribution.
Hint: You can split them up into, for example, three or five groups, from lowest to highest. Think about what would be helpful for examining this type of data low medium, high attendance? Or would it be lowest, low, medium, high, highest attendance?
Note: Split them up visually by putting a line between the categories by using the "borders" button on the "Font" group of the "Home" ribbon tab
Assign ordinal labels to each group
Go to the "Output" worksheet
Create a table with the folloet
Underline those two labellowing two labels: "Label" and "Values"
"Home" ribbon tab
"borders" button on the "Font" group of the values that correspo label each ordinal category in the "Labels" column, and the
Example: Labd to each category in the "Values" column
this, just an examphigh," and the values are does not have to be
Note: This is your Ordinal Scale
Step by Step Solution
There are 3 Steps involved in it
Step: 1

Get Instant Access to Expert-Tailored Solutions
See step-by-step solutions with expert insights and AI powered tools for academic success
Step: 2

Step: 3
Ace Your Homework with AI
Get the answers you need in no time with our AI-driven, step-by-step assistance
Get Started
A Complete Guide To Data Science Essentials
Authors: Miguel
1st Edition
9358684992, 978-9358684995