Question
(b) Consider the following regression output from a sample of 51 observations. Regression model: ???? = 12129.37 + 3.3076?????? + ?? se: (1197.351) (0.3117) R
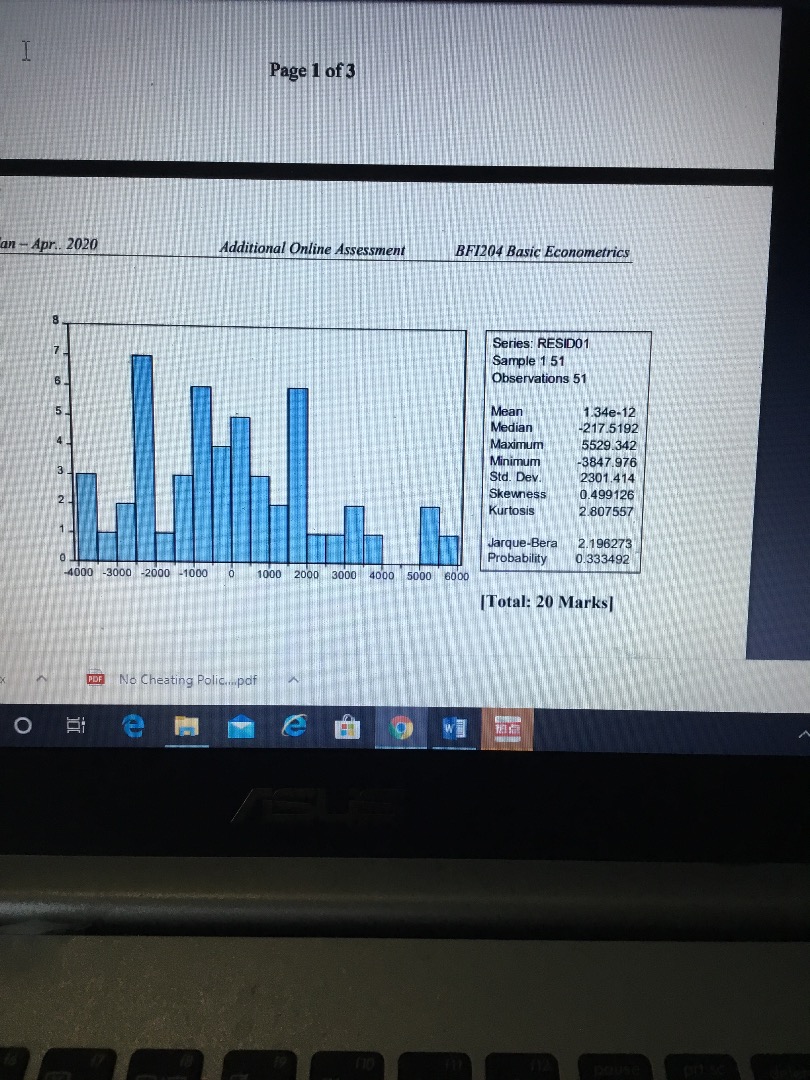
(b) Consider the following regression output from a sample of 51 observations. Regression model: ???? = 12129.37 + 3.3076?????? + ?? se: (1197.351) (0.3117) R 2 : 0.6968 Adjusted R2 : 0.6906 where Pay denotes teacher's pay and Spend denotes per-pupil expenditure. Both are in dollars ($). (i) Is the variable, Spend significant? If yes, prove the significance level. Interpret the variable too. (3 marks) (ii) Establish a 95% confidence interval for ?????. Would you reject the hypothesis that the true slope coefficient is 3.0? (4 marks) (iii) The value of R 2 is always higher than the value of adjusted R2 . What is/are the reason(s) for the higher R2 value? Which R 2 should you interpret? Justify and interpret your choice. (6 marks) (iv) Consider the following results of the Jarque-Bera test of normality. You are required to interpret the key indicators of the results. Decide if the results are reliable. Give a reason to support your answer. (4 marks) Jan - Apr.. 2020 Additional Online Assessment BFI204 Basic Econometrics Page 2 of 3 [Total: 20 Marks] Question 2 (a) A postgraduate student is researching to identify the determinants of Malaysia's imports. He has collected a set of data on imports, GDP, and the Consumer Price Index (CPI) over the period 1975 to 2005 and performs the following regression model. ?????????? = ?0 + ?1?????? + ?2?????t + ?? The regression results are presented in the following table. He is very happy with the results since both of the variables; GDP and CPI are significant at the 1% level. Do you agree with him? Explain why you agree/disagree with him. (5 marks) Dependent Variable: LNIMPORTS Method: Least Squares Date: 01/15/20 Time: 09:56 Sample: 1975 2005 Included observations: 31 Variable Coefficient Std. Error t-Statistic Prob. C 1.409416 0.270074 5.218629 0.0000 LNGDP 1.850099 0.182912 10.11471 0.0000 LNCPI -0.873369 0.284805 -3.066548 0.0048 R-squared 0.992005 Mean dependent var 13.08472 Adjusted R-squared 0.991434 S.D. dependent var 0.762092 S.E. of regression 0.070532 Akaike info criterion -2.373736 Sum squared resid 0.139293 Schwarz criterion -2.234963 Log likelihood 39.79291 Hannan-Quinn criter. -2.328500 F-statistic 1737.193 Durbin-Watson stat 0.650260 Prob(F-statistic) 0.000000 0 1 2 3 4 5 6 7 8 -4000 -3000 -2000 -1000 0 1000 2000 3000 4000 5000 6000 Series: RESID01 Sample 1 51 Observations 51 Mean 1.34e-12 Median -217.5192 Maximum 5529.342 Minimum -3847.976 Std. Dev. 2301.414 Skewness 0.499126 Kurtosis 2.807557 Jarque-Bera 2.196273 Probability 0.333492

Step by Step Solution
There are 3 Steps involved in it
Step: 1

Get Instant Access to Expert-Tailored Solutions
See step-by-step solutions with expert insights and AI powered tools for academic success
Step: 2

Step: 3

Ace Your Homework with AI
Get the answers you need in no time with our AI-driven, step-by-step assistance
Get Started


