

Answered step by step
Verified Expert Solution
Question
1 Approved Answer
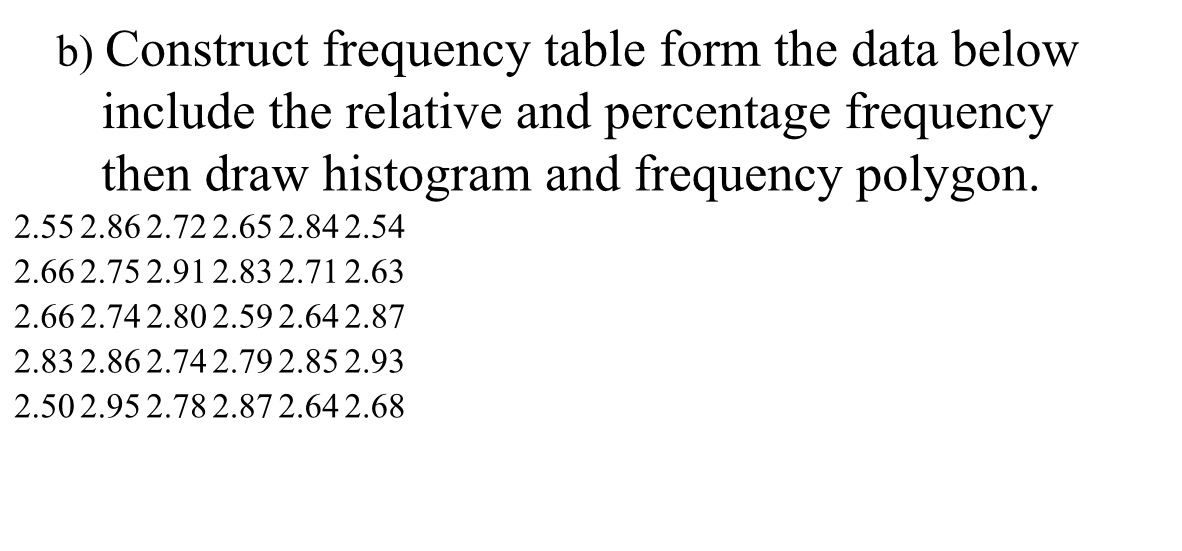
b) Construct frequency table form the data below include the relative and percentage frequency then draw histogram and frequency polygon. 2.552.862.722.65 2.84254 2.66 2.75 2.912.83
Step by Step Solution
There are 3 Steps involved in it
Step: 1

Get Instant Access to Expert-Tailored Solutions
See step-by-step solutions with expert insights and AI powered tools for academic success
Step: 2

Step: 3
Ace Your Homework with AI
Get the answers you need in no time with our AI-driven, step-by-step assistance
Get Started
Elementary Algebra
Authors: Charles P McKeague
2nd Edition
1483263819, 9781483263816