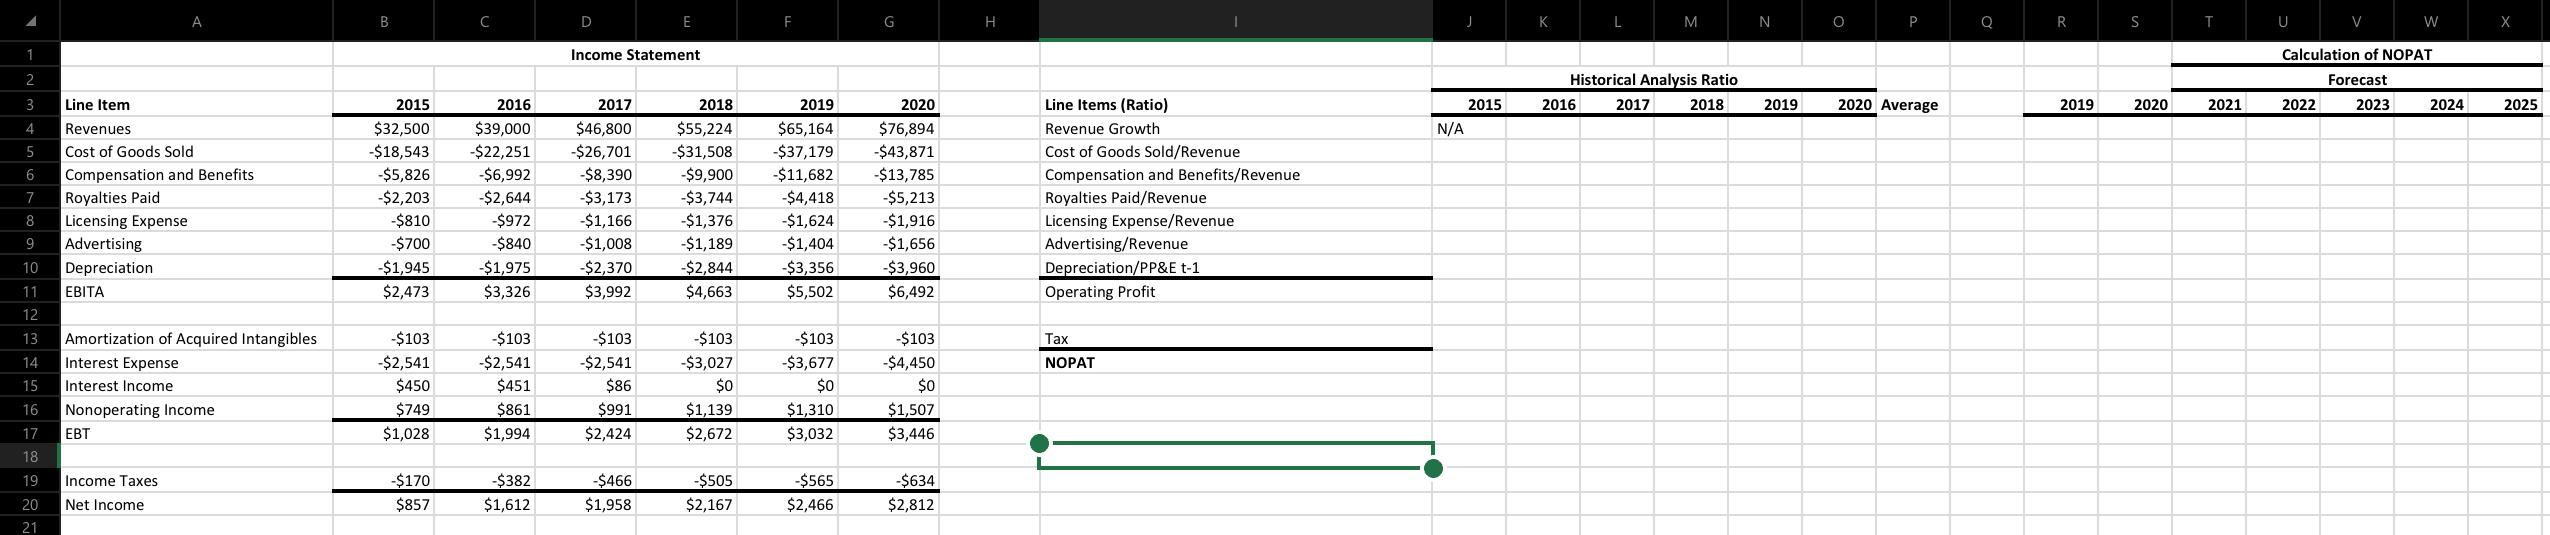
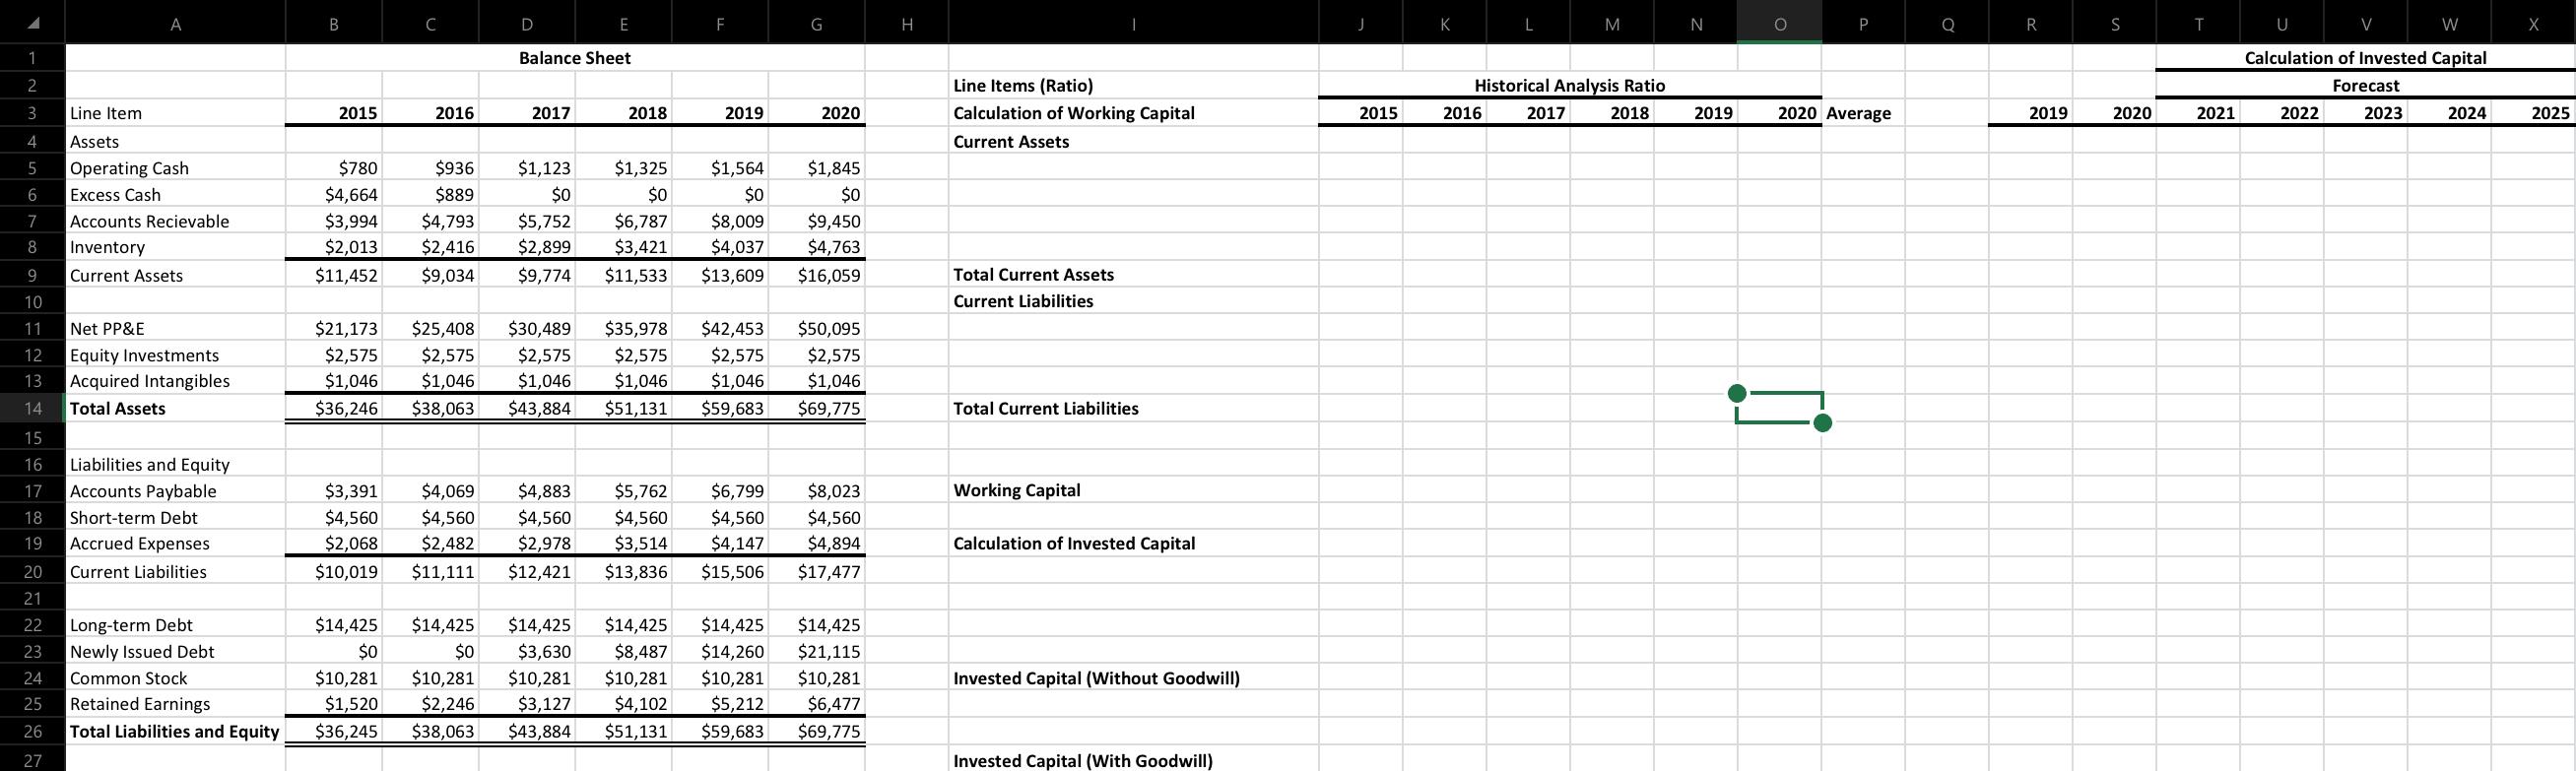
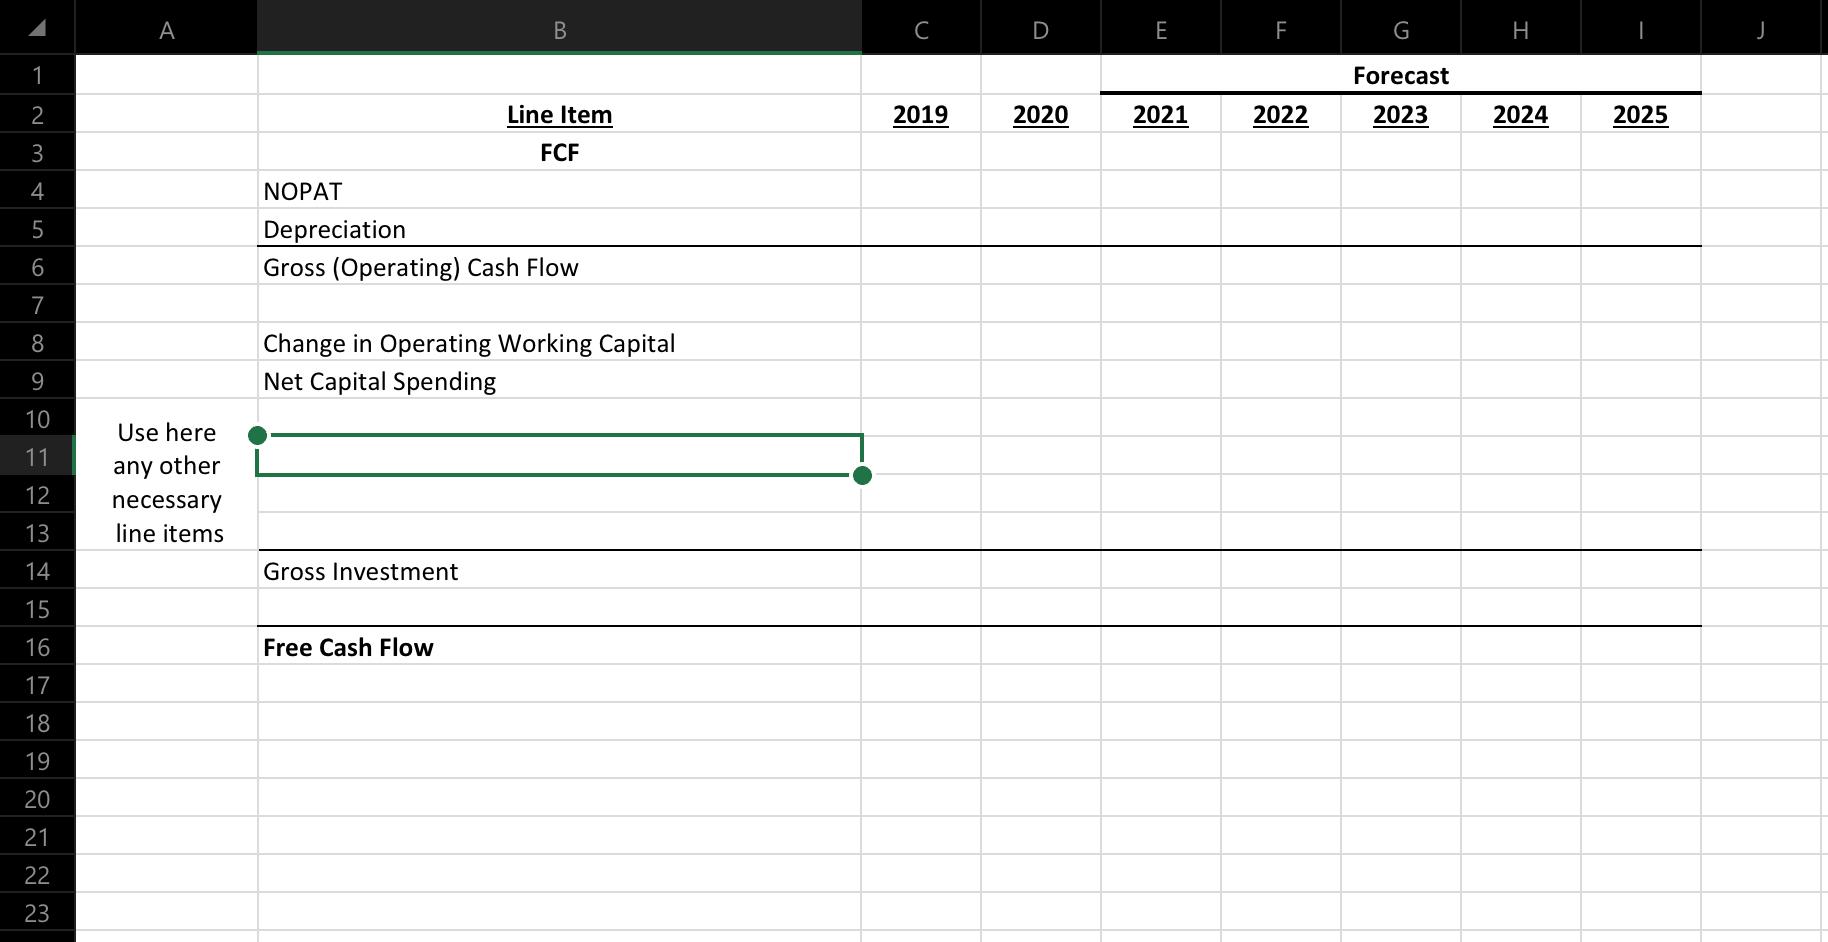
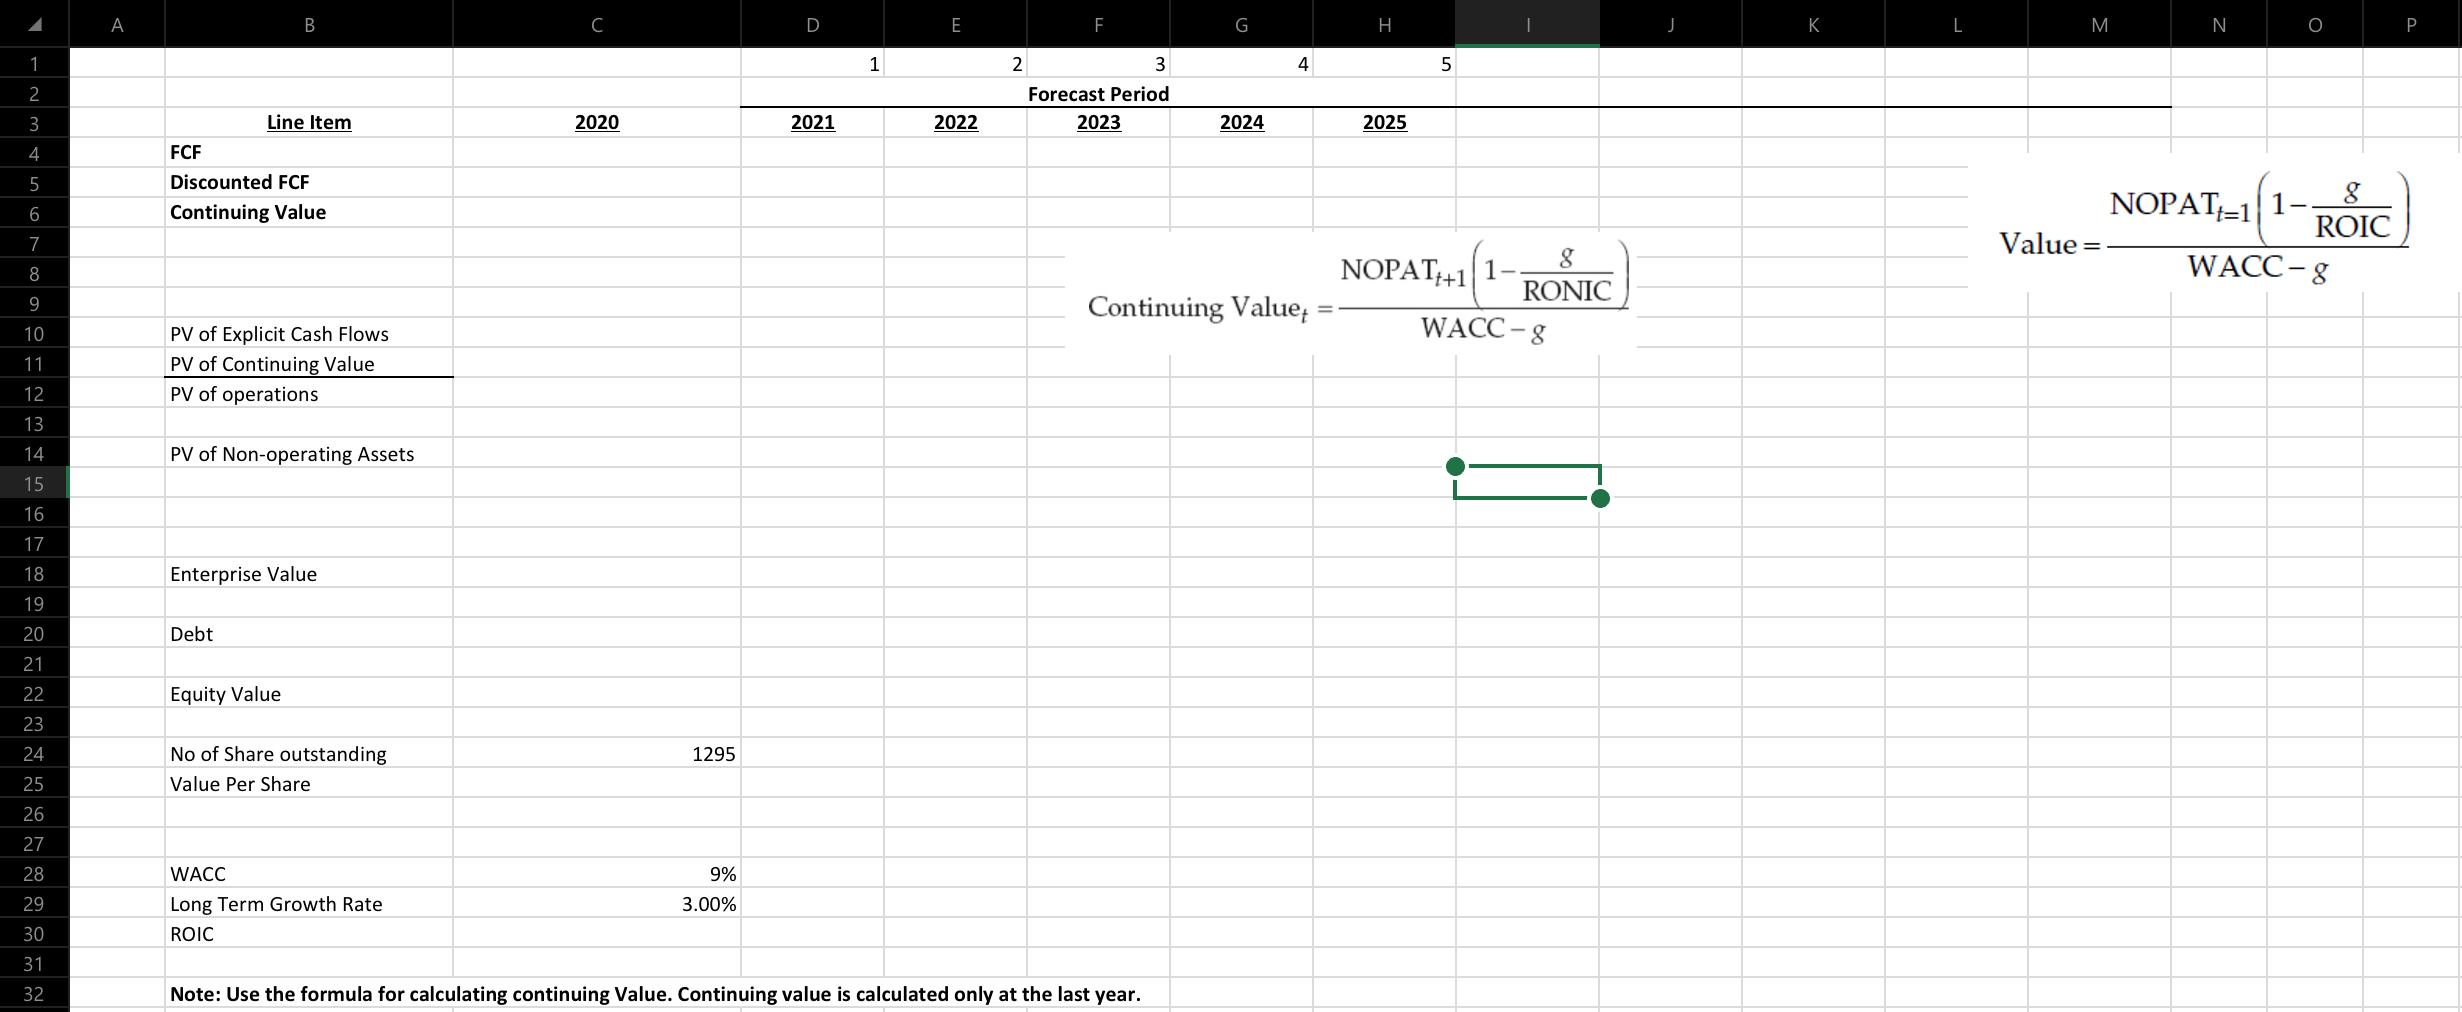
B D E G H L M N O P Q R S T U W 1 Income Statement Historical Analysis Ratio 2016 2018 Calculation of NOPAT Forecast 2022 2023 2024 2015 2017 2019 2020 Average 2019 2020 2021 2025 2 3 4 5 N/A 6 7 8 Line Item Revenues Cost of Goods Sold Compensation and Benefits Royalties Paid Licensing Expense Advertising Depreciation EBITA 2015 $32,500 $18,543 $5,826 $2,203 $810 $700 $1,945 $2,473 2016 $39,000 -$22,251 $6,992 -$2,644 $972 $840 $1,975 $3,326 2017 $46,800 $26,701 $8,390 $3,173 $1,166 $1,008 $2,370 $3,992 2018 $55,224 $31,508 $9,900 -$3,744 $1,376 $1,189 $2,844 $4,663 2019 $65,164 $37,179 $11,682 $4,418 $1,624 $1,404 $3,356 $5,502 2020 $76,894 $43,871 $13,785 $5,213 $1,916 $1,656 $3,960 $6,492 Line Items (Ratio) Revenue Growth Cost of Goods Sold/Revenue Compensation and Benefits/Revenue Royalties Paid/Revenue Licensing Expense/Revenue Advertising/Revenue Depreciation/PP&E t-1 Operating Profit 9 10 Tax 11 12 13 14 15 16 NOPAT Amortization of Acquired Intangibles Interest Expense Interest Income Nonoperating Income $103 $2,541 $450 $749 $1,028 $103 -$2,541 $451 $861 $103 $2,541 $86 $991 $2,424 $103 $3,027 $0 $1,139 $2,672 $103 $3,677 $0 $1,310 $3,032 $ 103 $4,450 $0 $1,507 $3,446 $1,994 17 18 19 Income Taxes $170 $857 $382 $1,612 $466 $1,958 $505 $2,167 $565 $2,466 $634 $2,812 20 Net Income 21 B D E F H M N Q R T W X 1 Balance Sheet 2 Historical Analysis Ratio 2016 2017 2018 3 Calculation of Invested Capital Forecast 2021 2022 2023 2024 Line Item 2015 2016 2017 2018 Line Items (Ratio) Calculation of Working Capital Current Assets 2019 2020 2015 2019 2020 Average 2019 2020 2025 4 5 6 Assets Operating Cash Excess Cash Accounts Recievable Inventory Current Assets 7 8 $780 $4,664 $3,994 $2,013 $11,452 $936 $889 $4,793 $2,416 $9,034 $1,123 $0 $5,752 $2,899 $9,774 $1,325 $0 $6,787 $3,421 $11,533 $1,564 $0 $8,009 $4,037 $13,609 $1,845 $o $9,450 $4,763 $16,059 9 Total Current Assets Current Liabilities 10 11 12 13 Net PP&E Equity Investments Acquired Intangibles Total Assets $21,173 $2,575 $1,046 $36,246 $25,408 $2,575 $1,046 $38,063 $30,489 $2,575 $1,046 $43,884 $35,978 $2,575 $1,046 $51,131 $42,453 $2,575 $1,046 $59,683 $50,095 $2,575 $1,046 $69,775 Total Current Liabilities 14 15 - 16 17 Working Capital 18 Liabilities and Equity Accounts Paybable Short-term Debt Accrued Expenses Current Liabilities $3,391 $4,560 $2,068 $10,019 $4,069 $4,560 $2,482 $11,111 $4,883 $4,560 $2,978 $12,421 $5,762 $4,560 $3,514 $13,836 $6,799 $4,560 $4,147 $15,506 $8,023 $4,560 $4,894 $17,477 19 Calculation of Invested Capital 20 21 22 23 24 25 26 Long-term Debt Newly Issued Debt Common Stock Retained Earnings Total Liabilities and Equity $14,425 $0 $10,281 $1,520 $36,245 $14,425 $0 $10,281 $2,246 $38,063 $14,425 $3,630 $10,281 $3,127 $43,884 $14,425 $8,487 $10,281 $4,102 $51,131 $14,425 $14,260 $10,281 $5,212 $59,683 $14,425 $21,115 $10,281 $6,477 $69,775 Invested Capital (Without Goodwill) 27 Invested Capital (With Goodwill) A B C D E F G H 1. Forecast 2 Line Item 2019 2020 2021 2022 2023 2024 2025 3 4. FCF NOPAT Depreciation Gross (Operating) Cash Flow 5 6 7 8 Change in Operating Working Capital Net Capital Spending 9 10 Use here 11 any other 12 necessary line items 13 14 Gross Investment 15 16 Free Cash Flow 17 18 19 20 21 22 23 A B D E F. G M N O P 1 1 4 5 2 2 3 Forecast Period 2023 3 2020 2021 2022 2024 2025 4 Line Item FCF Discounted FCF Continuing Value 5 6 Value g NOPAT=11 ROIC WACC-8 7 8 Continuing Value 9 10 11 NOPAT++1 RONIC WACC-8 PV of Explicit Cash Flows PV of Continuing Value PV of operations 12 13 PV of Non-operating Assets 14 15 16 17 18 Enterprise Value Debt Equity Value 19 20 21 22 23 24 25 26 27 1295 No of Share outstanding Value Per Share 28 WACC Long Term Growth Rate ROIC 9% 3.00% 29 30 31 32 Note: Use the formula for calculating continuing Value. Continuing value is calculated only at the last year. B D E G H L M N O P Q R S T U W 1 Income Statement Historical Analysis Ratio 2016 2018 Calculation of NOPAT Forecast 2022 2023 2024 2015 2017 2019 2020 Average 2019 2020 2021 2025 2 3 4 5 N/A 6 7 8 Line Item Revenues Cost of Goods Sold Compensation and Benefits Royalties Paid Licensing Expense Advertising Depreciation EBITA 2015 $32,500 $18,543 $5,826 $2,203 $810 $700 $1,945 $2,473 2016 $39,000 -$22,251 $6,992 -$2,644 $972 $840 $1,975 $3,326 2017 $46,800 $26,701 $8,390 $3,173 $1,166 $1,008 $2,370 $3,992 2018 $55,224 $31,508 $9,900 -$3,744 $1,376 $1,189 $2,844 $4,663 2019 $65,164 $37,179 $11,682 $4,418 $1,624 $1,404 $3,356 $5,502 2020 $76,894 $43,871 $13,785 $5,213 $1,916 $1,656 $3,960 $6,492 Line Items (Ratio) Revenue Growth Cost of Goods Sold/Revenue Compensation and Benefits/Revenue Royalties Paid/Revenue Licensing Expense/Revenue Advertising/Revenue Depreciation/PP&E t-1 Operating Profit 9 10 Tax 11 12 13 14 15 16 NOPAT Amortization of Acquired Intangibles Interest Expense Interest Income Nonoperating Income $103 $2,541 $450 $749 $1,028 $103 -$2,541 $451 $861 $103 $2,541 $86 $991 $2,424 $103 $3,027 $0 $1,139 $2,672 $103 $3,677 $0 $1,310 $3,032 $ 103 $4,450 $0 $1,507 $3,446 $1,994 17 18 19 Income Taxes $170 $857 $382 $1,612 $466 $1,958 $505 $2,167 $565 $2,466 $634 $2,812 20 Net Income 21 B D E F H M N Q R T W X 1 Balance Sheet 2 Historical Analysis Ratio 2016 2017 2018 3 Calculation of Invested Capital Forecast 2021 2022 2023 2024 Line Item 2015 2016 2017 2018 Line Items (Ratio) Calculation of Working Capital Current Assets 2019 2020 2015 2019 2020 Average 2019 2020 2025 4 5 6 Assets Operating Cash Excess Cash Accounts Recievable Inventory Current Assets 7 8 $780 $4,664 $3,994 $2,013 $11,452 $936 $889 $4,793 $2,416 $9,034 $1,123 $0 $5,752 $2,899 $9,774 $1,325 $0 $6,787 $3,421 $11,533 $1,564 $0 $8,009 $4,037 $13,609 $1,845 $o $9,450 $4,763 $16,059 9 Total Current Assets Current Liabilities 10 11 12 13 Net PP&E Equity Investments Acquired Intangibles Total Assets $21,173 $2,575 $1,046 $36,246 $25,408 $2,575 $1,046 $38,063 $30,489 $2,575 $1,046 $43,884 $35,978 $2,575 $1,046 $51,131 $42,453 $2,575 $1,046 $59,683 $50,095 $2,575 $1,046 $69,775 Total Current Liabilities 14 15 - 16 17 Working Capital 18 Liabilities and Equity Accounts Paybable Short-term Debt Accrued Expenses Current Liabilities $3,391 $4,560 $2,068 $10,019 $4,069 $4,560 $2,482 $11,111 $4,883 $4,560 $2,978 $12,421 $5,762 $4,560 $3,514 $13,836 $6,799 $4,560 $4,147 $15,506 $8,023 $4,560 $4,894 $17,477 19 Calculation of Invested Capital 20 21 22 23 24 25 26 Long-term Debt Newly Issued Debt Common Stock Retained Earnings Total Liabilities and Equity $14,425 $0 $10,281 $1,520 $36,245 $14,425 $0 $10,281 $2,246 $38,063 $14,425 $3,630 $10,281 $3,127 $43,884 $14,425 $8,487 $10,281 $4,102 $51,131 $14,425 $14,260 $10,281 $5,212 $59,683 $14,425 $21,115 $10,281 $6,477 $69,775 Invested Capital (Without Goodwill) 27 Invested Capital (With Goodwill) A B C D E F G H 1. Forecast 2 Line Item 2019 2020 2021 2022 2023 2024 2025 3 4. FCF NOPAT Depreciation Gross (Operating) Cash Flow 5 6 7 8 Change in Operating Working Capital Net Capital Spending 9 10 Use here 11 any other 12 necessary line items 13 14 Gross Investment 15 16 Free Cash Flow 17 18 19 20 21 22 23 A B D E F. G M N O P 1 1 4 5 2 2 3 Forecast Period 2023 3 2020 2021 2022 2024 2025 4 Line Item FCF Discounted FCF Continuing Value 5 6 Value g NOPAT=11 ROIC WACC-8 7 8 Continuing Value 9 10 11 NOPAT++1 RONIC WACC-8 PV of Explicit Cash Flows PV of Continuing Value PV of operations 12 13 PV of Non-operating Assets 14 15 16 17 18 Enterprise Value Debt Equity Value 19 20 21 22 23 24 25 26 27 1295 No of Share outstanding Value Per Share 28 WACC Long Term Growth Rate ROIC 9% 3.00% 29 30 31 32 Note: Use the formula for calculating continuing Value. Continuing value is calculated only at the last year