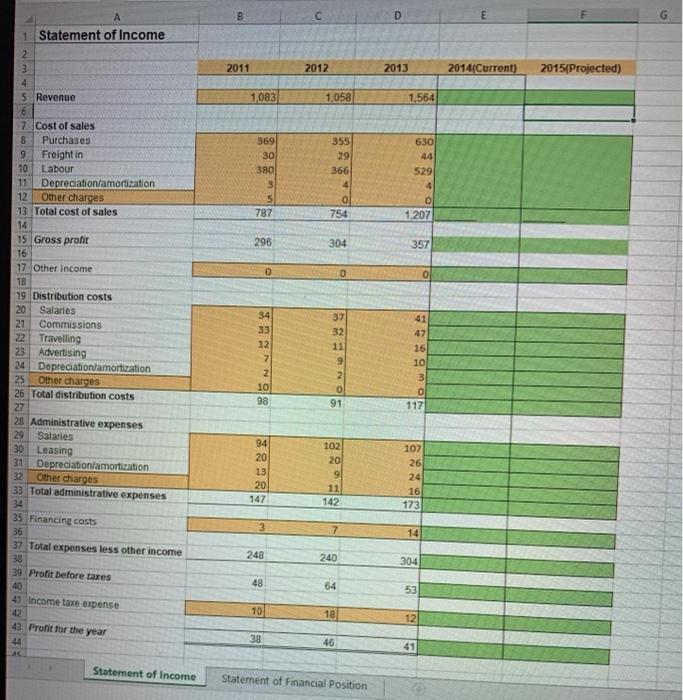
B D G 2011 2012 2013 2014(Current) 2015(Projected) 1,083 1.058 1.564 630 369 30 380 3 5 787 355 29 366 4 529 4 0 1,207 754 296 304 357 0 0 0 1 Statement of Income 2 3 4 5 Revenue 6 7 Cost of sales 8 Purchases 9 Freight in 10 Labour 11 Depreciation/amortization 12 Other charges 13 Total cost of sales 14 15 Gross profit 16 17 Other income 18 19 Distribution costs 20 Salaries 21 Commissions 22 Travelling 23 Advertising 24 Depreciation amortization 25 Other charges 26 Total distribution costs 27 28 Administrative expenses 29 Salaries 30 Leasing 31 Depreciation amortization 32 Other charges 33 Total administrative expenses 34 35 Financing costs 36 37 Total expenses less other income 38 39 Profit before taxes 40 41 47 34 33 12 7 2 10 98 37 32 11 9 16 10 91 117 94 20 13 20 147 102 20 9 11 142 107 26 24 16 173 3 7 14 248 240 304 48 64 53 10 18 41 Income taxe expense 42 43 Profit for the year 44 12 38 46 41 Statement of Income Statement of Financial Position B D G 2011 2012 2013 2014(Current) 2015(Projected) 1,083 1.058 1.564 630 369 30 380 3 5 787 355 29 366 4 529 4 0 1,207 754 296 304 357 0 0 0 1 Statement of Income 2 3 4 5 Revenue 6 7 Cost of sales 8 Purchases 9 Freight in 10 Labour 11 Depreciation/amortization 12 Other charges 13 Total cost of sales 14 15 Gross profit 16 17 Other income 18 19 Distribution costs 20 Salaries 21 Commissions 22 Travelling 23 Advertising 24 Depreciation amortization 25 Other charges 26 Total distribution costs 27 28 Administrative expenses 29 Salaries 30 Leasing 31 Depreciation amortization 32 Other charges 33 Total administrative expenses 34 35 Financing costs 36 37 Total expenses less other income 38 39 Profit before taxes 40 41 47 34 33 12 7 2 10 98 37 32 11 9 16 10 91 117 94 20 13 20 147 102 20 9 11 142 107 26 24 16 173 3 7 14 248 240 304 48 64 53 10 18 41 Income taxe expense 42 43 Profit for the year 44 12 38 46 41 Statement of Income Statement of Financial Position