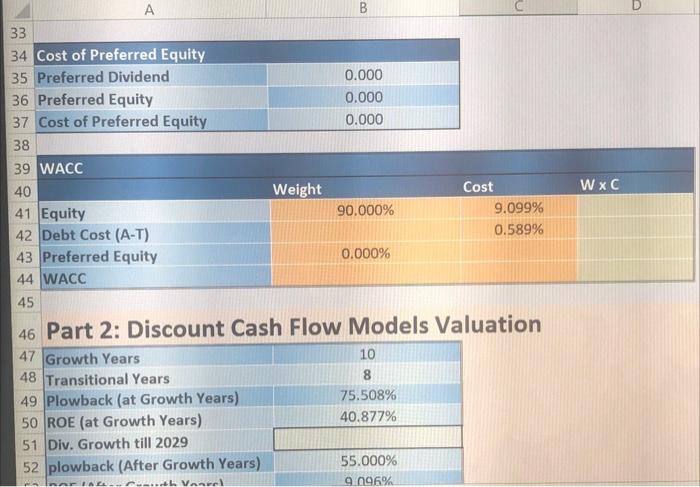
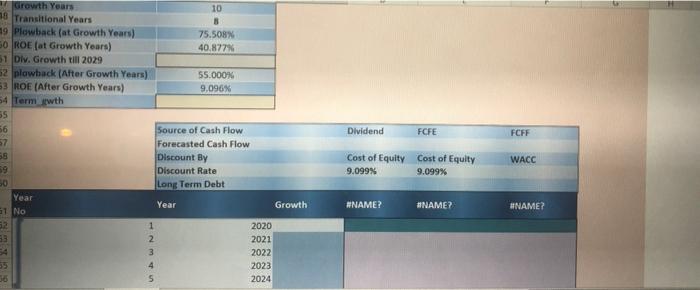
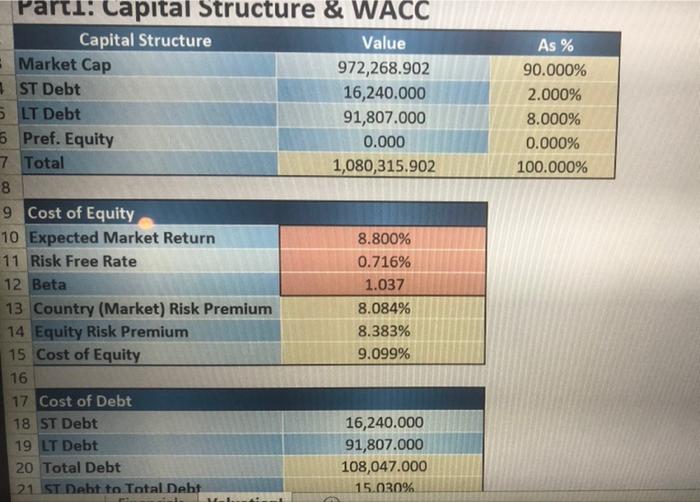
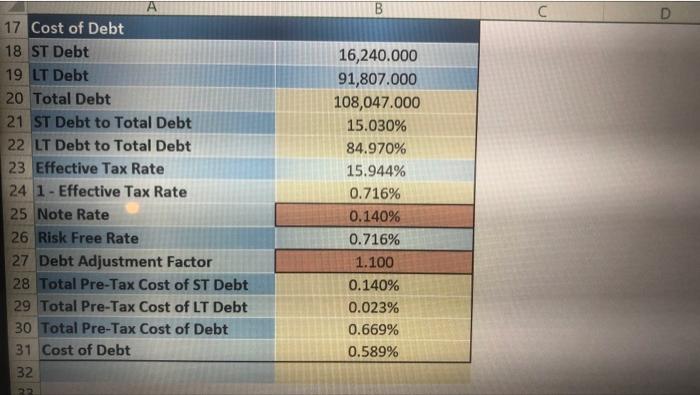
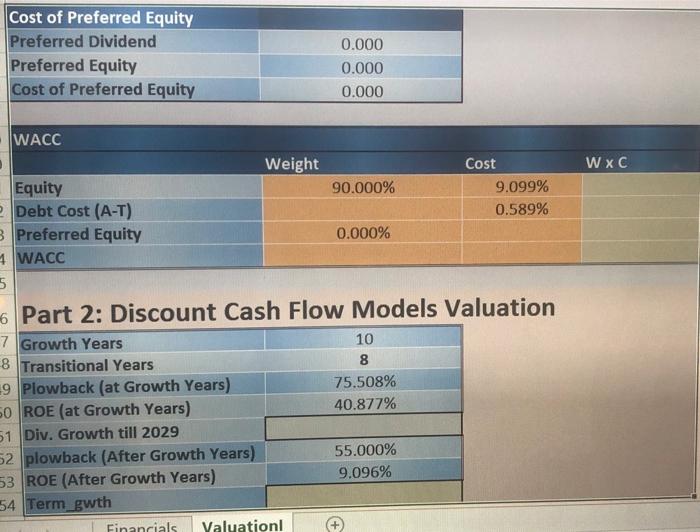
B D WxC 33 34 Cost of Preferred Equity 35 Preferred Dividend 0.000 36 Preferred Equity 0.000 37 Cost of Preferred Equity 0.000 38 39 WACC 40 Weight Cost 41 Equity 90.000% 9.099% 42 Debt Cost (A-T) 0.589% 43 Preferred Equity 0.000% 44 WACC 45 46 Part 2: Discount Cash Flow Models Valuation 47 Growth Years 10 48 Transitional Years 8 49 Plowback (at Growth Years) 75.508% 50 ROE (at Growth Years) 40.877% 51 Div. Growth till 2029 52 plowback (After Growth Years) 55.000% 9.096% nAE C. Van Dividend FCFE FCFF Growth Years 10 8 Transitional Years 8 99 Plowback (at Growth Years) 75.508% 50 ROE (at Growth Years) 40,877 51 Div. Growth till 2029 52 plawback (After Growth Years) 55.000% 53 ROE (After Growth Years) 9.096% 54 Term wth 55 56 Source of Cash Flow 57 Forecasted Cash Flow 58 Discount By 19 Discount Rate 50 Long Term Debt Year Growth G1 No 52 1 2020 13 2 2021 34 3 2022 35 4 2023 2024 Cost of Equity Cost of Equity 9.099% 9.099% WACC Year #NAME? ANAME? UNAME? As % 90.000% 2.000% 8.000% 0.000% 100.000% Parti: Capital Structure & WACC Capital Structure Value - Market Cap 972,268.902 ST Debt 16,240.000 5 LT Debt 91,807.000 6 Pref. Equity 0.000 7 Total 1,080,315.902 8 9 Cost of Equity 10 Expected Market Return 8.800% 11 Risk Free Rate 0.716% 12 Beta 1.037 13 Country (Market) Risk Premium 8.084% 14 Equity Risk Premium 8.383% 15 Cost of Equity 9.099% 16 17 Cost of Debt 18 ST Debt 19 LT Debt 20 Total Debt 21 ST Debt to Total Debt 16,240.000 91,807.000 108,047.000 15.030% B A 17 Cost of Debt 18 ST Debt 19 LT Debt 20 Total Debt 21 ST Debt to Total Debt 22 LT Debt to Total Debt 23 Effective Tax Rate 24 1 - Effective Tax Rate 25 Note Rate 26 Risk Free Rate 27 Debt Adjustment Factor 28 Total Pre-Tax Cost of ST Debt 29 Total Pre-Tax Cost of LT Debt 30 Total Pre-Tax Cost of Debt 31 Cost of Debt 32 16,240.000 91,807.000 108,047.000 15.030% 84.970% 15.944% 0.716% 0.140% 0.716% 1.100 0.140% 0.023% 0.669% 0.589% 2 PR Cost of Preferred Equity Preferred Dividend Preferred Equity Cost of Preferred Equity 0.000 0.000 0.000 WACC WxC Weight Cost Equity 90.000% 9.099% Debt Cost (A-T) 0.589% 3 Preferred Equity 0.000% 1 WACC 5 6 Part 2: Discount Cash Flow Models Valuation 7 Growth Years 10 8 Transitional Years 8 9 Plowback (at Growth Years) 75.508% 50 ROE (at Growth Years) 40.877% 51 Div. Growth till 2029 52 plowback (After Growth Years) 55.000% 53 ROE (After Growth Years) 9.096% 54 Term_gwth Financials Valuation B D WxC 33 34 Cost of Preferred Equity 35 Preferred Dividend 0.000 36 Preferred Equity 0.000 37 Cost of Preferred Equity 0.000 38 39 WACC 40 Weight Cost 41 Equity 90.000% 9.099% 42 Debt Cost (A-T) 0.589% 43 Preferred Equity 0.000% 44 WACC 45 46 Part 2: Discount Cash Flow Models Valuation 47 Growth Years 10 48 Transitional Years 8 49 Plowback (at Growth Years) 75.508% 50 ROE (at Growth Years) 40.877% 51 Div. Growth till 2029 52 plowback (After Growth Years) 55.000% 9.096% nAE C. Van Dividend FCFE FCFF Growth Years 10 8 Transitional Years 8 99 Plowback (at Growth Years) 75.508% 50 ROE (at Growth Years) 40,877 51 Div. Growth till 2029 52 plawback (After Growth Years) 55.000% 53 ROE (After Growth Years) 9.096% 54 Term wth 55 56 Source of Cash Flow 57 Forecasted Cash Flow 58 Discount By 19 Discount Rate 50 Long Term Debt Year Growth G1 No 52 1 2020 13 2 2021 34 3 2022 35 4 2023 2024 Cost of Equity Cost of Equity 9.099% 9.099% WACC Year #NAME? ANAME? UNAME? As % 90.000% 2.000% 8.000% 0.000% 100.000% Parti: Capital Structure & WACC Capital Structure Value - Market Cap 972,268.902 ST Debt 16,240.000 5 LT Debt 91,807.000 6 Pref. Equity 0.000 7 Total 1,080,315.902 8 9 Cost of Equity 10 Expected Market Return 8.800% 11 Risk Free Rate 0.716% 12 Beta 1.037 13 Country (Market) Risk Premium 8.084% 14 Equity Risk Premium 8.383% 15 Cost of Equity 9.099% 16 17 Cost of Debt 18 ST Debt 19 LT Debt 20 Total Debt 21 ST Debt to Total Debt 16,240.000 91,807.000 108,047.000 15.030% B A 17 Cost of Debt 18 ST Debt 19 LT Debt 20 Total Debt 21 ST Debt to Total Debt 22 LT Debt to Total Debt 23 Effective Tax Rate 24 1 - Effective Tax Rate 25 Note Rate 26 Risk Free Rate 27 Debt Adjustment Factor 28 Total Pre-Tax Cost of ST Debt 29 Total Pre-Tax Cost of LT Debt 30 Total Pre-Tax Cost of Debt 31 Cost of Debt 32 16,240.000 91,807.000 108,047.000 15.030% 84.970% 15.944% 0.716% 0.140% 0.716% 1.100 0.140% 0.023% 0.669% 0.589% 2 PR Cost of Preferred Equity Preferred Dividend Preferred Equity Cost of Preferred Equity 0.000 0.000 0.000 WACC WxC Weight Cost Equity 90.000% 9.099% Debt Cost (A-T) 0.589% 3 Preferred Equity 0.000% 1 WACC 5 6 Part 2: Discount Cash Flow Models Valuation 7 Growth Years 10 8 Transitional Years 8 9 Plowback (at Growth Years) 75.508% 50 ROE (at Growth Years) 40.877% 51 Div. Growth till 2029 52 plowback (After Growth Years) 55.000% 53 ROE (After Growth Years) 9.096% 54 Term_gwth Financials Valuation
