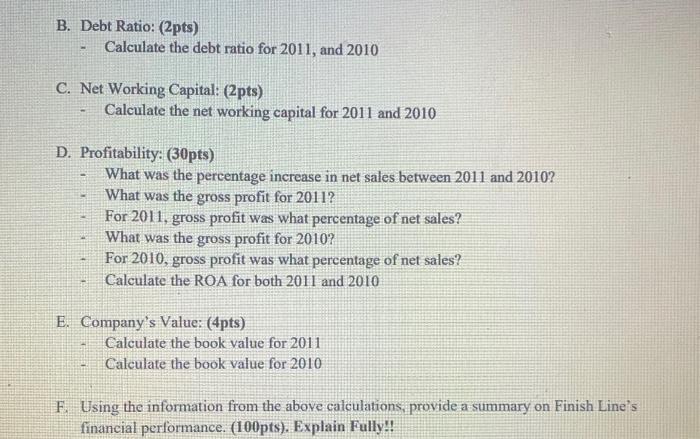
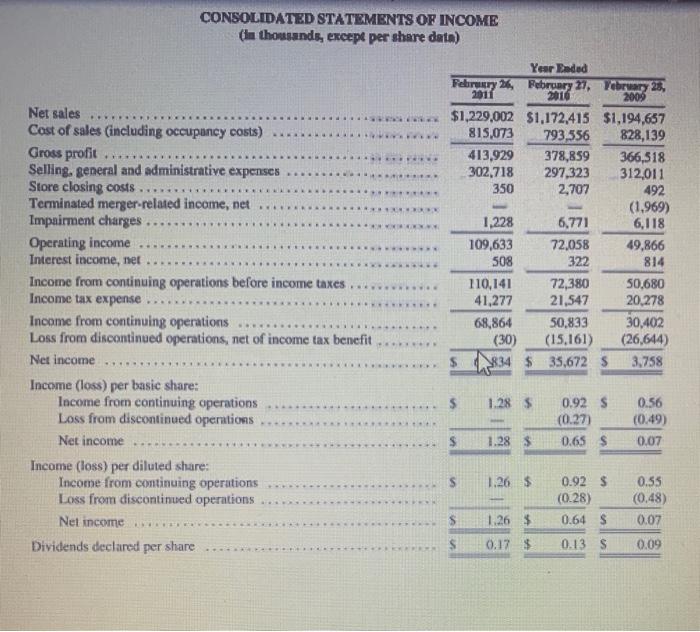
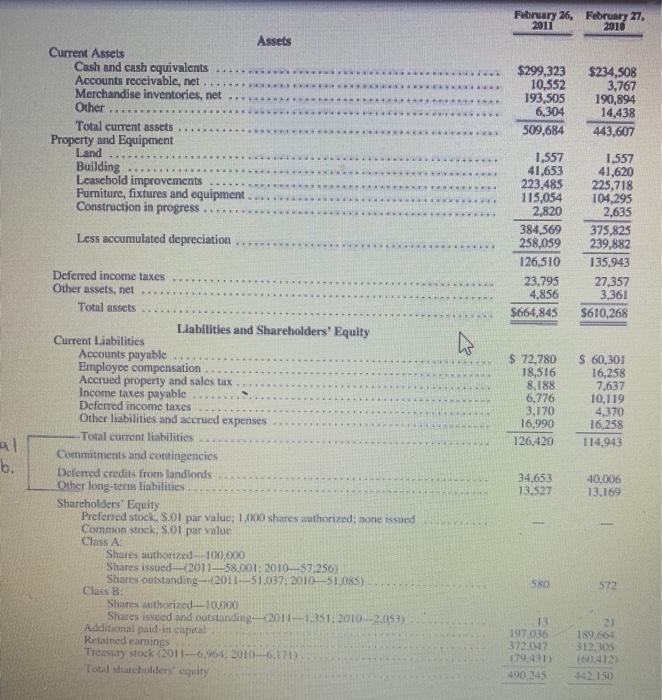
B. Debt Ratio: (2pts) Calculate the debt ratio for 2011, and 2010 C. Net Working Capital: (2pts) Calculate the net working capital for 2011 and 2010 D. Profitability: (30pts) What was the percentage increase in net sales between 2011 and 2010? What was the gross profit for 2011? For 2011, gross profit was what percentage of net sales? What was the gross profit for 2010? For 2010, gross profit was what percentage of net sales? Calculate the ROA for both 2011 and 2010 E. Company's Value: (4pts) Calculate the book value for 2011 Calculate the book value for 2010 F. Using the information from the above calculations provide a summary on Finish Line's financial performance. (100pts). Explain Fully!! CONSOLIDATED STATEMENTS OF INCOME in thousands, excepe per share data) Year Ended February 26, February 27, Yebruary 25, 2011 2010 2009 $1,229,002 $1,172,415 $1,194,657 815,073 793,556 828,139 413,929 378,859 366,518 302,718 297,323 312,011 350 2,707 492 (1.969) 1,228 6,771 6,118 109,633 72,058 49.866 508 322 814 110,141 72,380 50,680 41,277 21,547 20,278 68,864 50.833 30,402 (30) (15,161) (26,644) 1834 $ 35,672 S 3,758 Net sales Cost of sales (including occupancy costs) Gross profit Selling, general and administrative expenses Store closing costs Terminated merger-related income, net Impairment charges Operating income Interest income, net Income from continuing operations before income taxes Income tax expense Income from continuing operations Loss from discontinued operations, net of income tax benefit Net income Income (loss) per basic share: Income from continuing operations Loss from discontinued operations Net income Income (loss) per diluted share: Income from continuing operations Loss from discontinued operations Net income Dividends declared per share RE $ 1.28 $ 0.92 S (0.27) 0.65 $ 0.56 (0.49) $ 1.28 $ 0.07 1.26 $ 1.26 $ 0.17 $ 0.92 $ (0.28) 0.64 $ 0.13 S 0.55 (0.48) 0.07 0.09 February 26, February 27, 2011 2016 ** ***** - + Assets Current Assets Cash and cash equivalents Accounts receivable, net Merchandise inventories, net Other Total current assets Property and Equipment Land Building Leasehold improvements Furniture, fixtures and equipment. Construction in progress $299,323 10,552 193,505 6,304 509,684 $234,508 3,767 190,894 14.438 443,607 . Less accumulated depreciation 1,557 41,653 223,485 115,054 2,820 384,569 258,059 126,510 23.795 4,856 $664,845 1,557 41,620 225,718 104,295 2,635 375,825 239,882 135,943 27.357 3,361 $610,268 $ 72,780 18,516 8,188 6,776 3,170 16,990 126,420 S 60,301 16,258 7,637 10,119 4,370 16,258 114,943 b. Deferred income taxes Other assets, nel Total assets Liabilities and Shareholders' Equity Current Liabilities Accounts payable Employee compensation Accrued property and sales tax Income taxes payable Deferred income taxes Other liabilities and accrued expenses -Total current liabilities Commitments and contingencies Deemed credits from landlords Other long-term liabilities Shareholders' Equity Preferred stock 8.01 par value: 1,000 shares authorized: none issued Common stock, S.01 par value Class A Shares authorized - 100.000 Shares issued 201158.001: 201057.256) Shares outstanding-2011-51.037 2010-51,085) Class B Shures authorized_10.000 Shares issued and outstanding 2011-1.351.2010.-203) Additional paid in capital Retained carings Treasury stock (2011-6,964 2010-11 Total shareholders quity 34,653 13.527 40.006 13.169 49 580 572 2 189.664 312.05 197.036 372.012 79.40 490.245 B. Debt Ratio: (2pts) Calculate the debt ratio for 2011, and 2010 C. Net Working Capital: (2pts) Calculate the net working capital for 2011 and 2010 D. Profitability: (30pts) What was the percentage increase in net sales between 2011 and 2010? What was the gross profit for 2011? For 2011, gross profit was what percentage of net sales? What was the gross profit for 2010? For 2010, gross profit was what percentage of net sales? Calculate the ROA for both 2011 and 2010 E. Company's Value: (4pts) Calculate the book value for 2011 Calculate the book value for 2010 F. Using the information from the above calculations provide a summary on Finish Line's financial performance. (100pts). Explain Fully!! CONSOLIDATED STATEMENTS OF INCOME in thousands, excepe per share data) Year Ended February 26, February 27, Yebruary 25, 2011 2010 2009 $1,229,002 $1,172,415 $1,194,657 815,073 793,556 828,139 413,929 378,859 366,518 302,718 297,323 312,011 350 2,707 492 (1.969) 1,228 6,771 6,118 109,633 72,058 49.866 508 322 814 110,141 72,380 50,680 41,277 21,547 20,278 68,864 50.833 30,402 (30) (15,161) (26,644) 1834 $ 35,672 S 3,758 Net sales Cost of sales (including occupancy costs) Gross profit Selling, general and administrative expenses Store closing costs Terminated merger-related income, net Impairment charges Operating income Interest income, net Income from continuing operations before income taxes Income tax expense Income from continuing operations Loss from discontinued operations, net of income tax benefit Net income Income (loss) per basic share: Income from continuing operations Loss from discontinued operations Net income Income (loss) per diluted share: Income from continuing operations Loss from discontinued operations Net income Dividends declared per share RE $ 1.28 $ 0.92 S (0.27) 0.65 $ 0.56 (0.49) $ 1.28 $ 0.07 1.26 $ 1.26 $ 0.17 $ 0.92 $ (0.28) 0.64 $ 0.13 S 0.55 (0.48) 0.07 0.09 February 26, February 27, 2011 2016 ** ***** - + Assets Current Assets Cash and cash equivalents Accounts receivable, net Merchandise inventories, net Other Total current assets Property and Equipment Land Building Leasehold improvements Furniture, fixtures and equipment. Construction in progress $299,323 10,552 193,505 6,304 509,684 $234,508 3,767 190,894 14.438 443,607 . Less accumulated depreciation 1,557 41,653 223,485 115,054 2,820 384,569 258,059 126,510 23.795 4,856 $664,845 1,557 41,620 225,718 104,295 2,635 375,825 239,882 135,943 27.357 3,361 $610,268 $ 72,780 18,516 8,188 6,776 3,170 16,990 126,420 S 60,301 16,258 7,637 10,119 4,370 16,258 114,943 b. Deferred income taxes Other assets, nel Total assets Liabilities and Shareholders' Equity Current Liabilities Accounts payable Employee compensation Accrued property and sales tax Income taxes payable Deferred income taxes Other liabilities and accrued expenses -Total current liabilities Commitments and contingencies Deemed credits from landlords Other long-term liabilities Shareholders' Equity Preferred stock 8.01 par value: 1,000 shares authorized: none issued Common stock, S.01 par value Class A Shares authorized - 100.000 Shares issued 201158.001: 201057.256) Shares outstanding-2011-51.037 2010-51,085) Class B Shures authorized_10.000 Shares issued and outstanding 2011-1.351.2010.-203) Additional paid in capital Retained carings Treasury stock (2011-6,964 2010-11 Total shareholders quity 34,653 13.527 40.006 13.169 49 580 572 2 189.664 312.05 197.036 372.012 79.40 490.245


