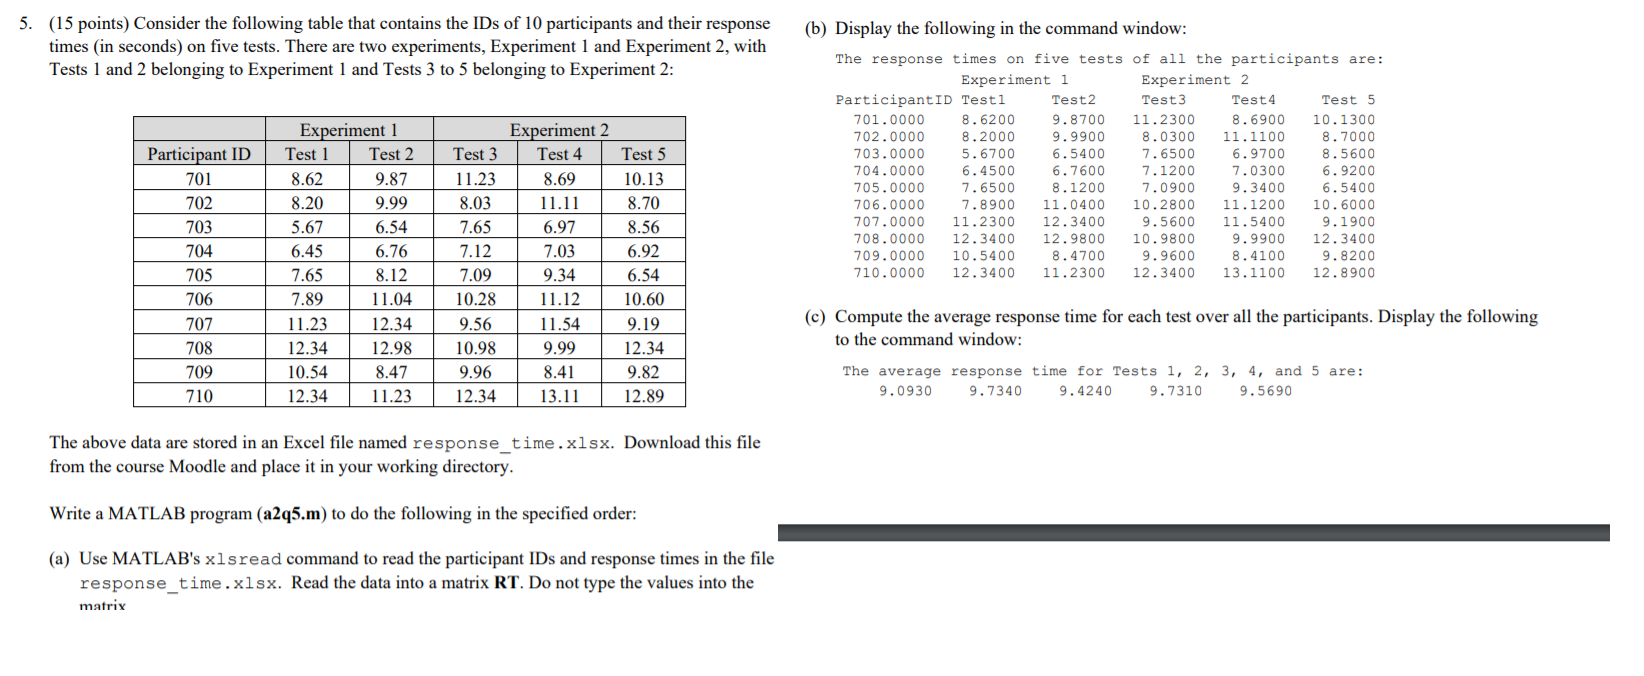
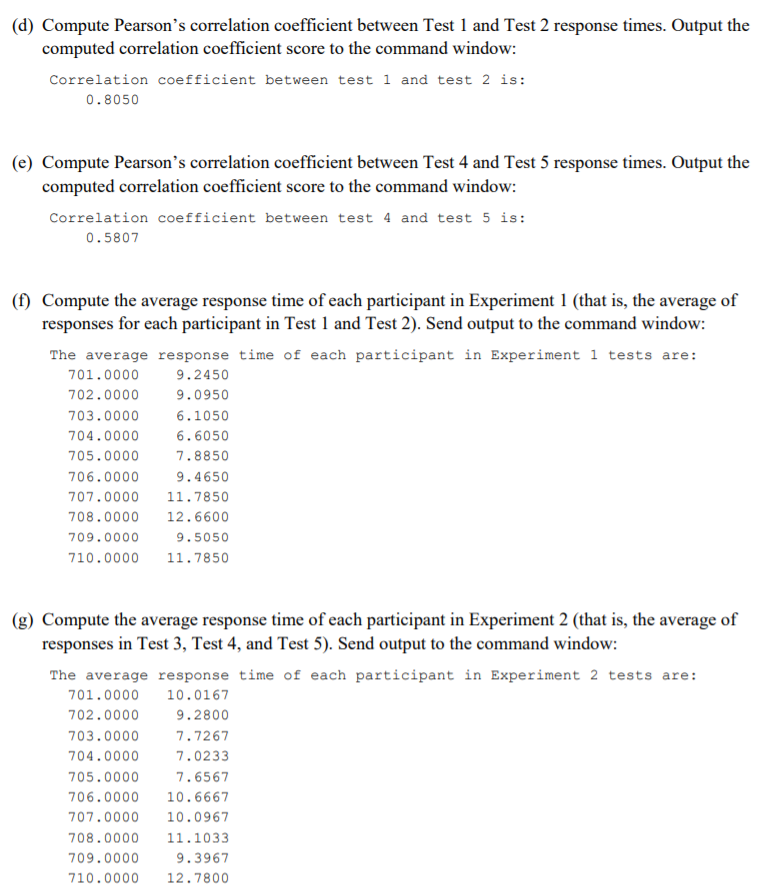
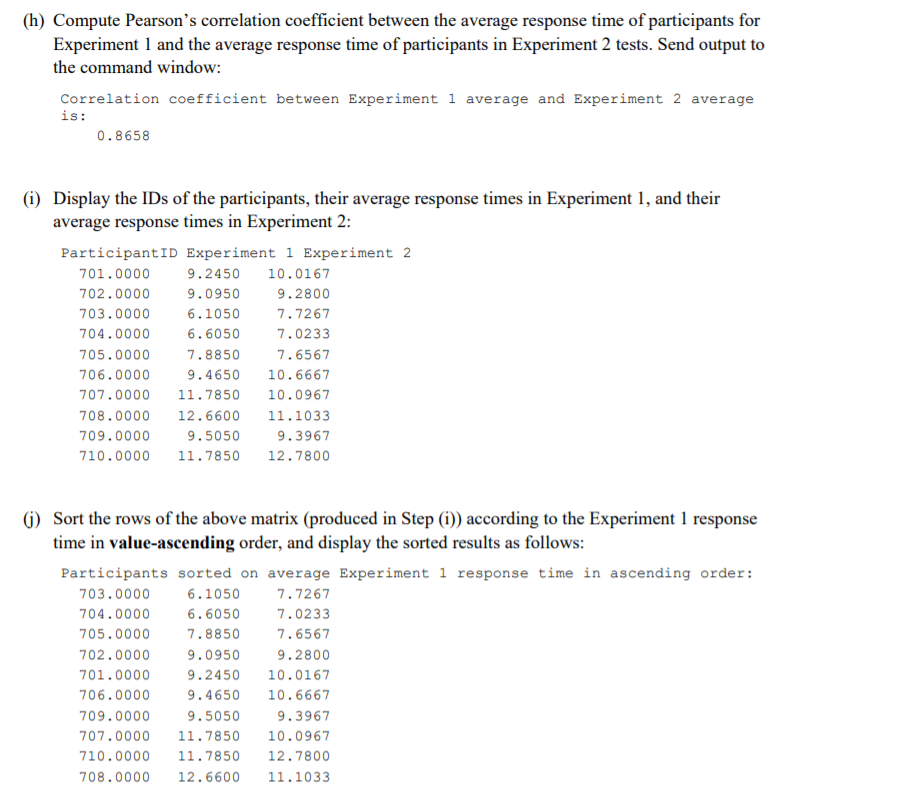
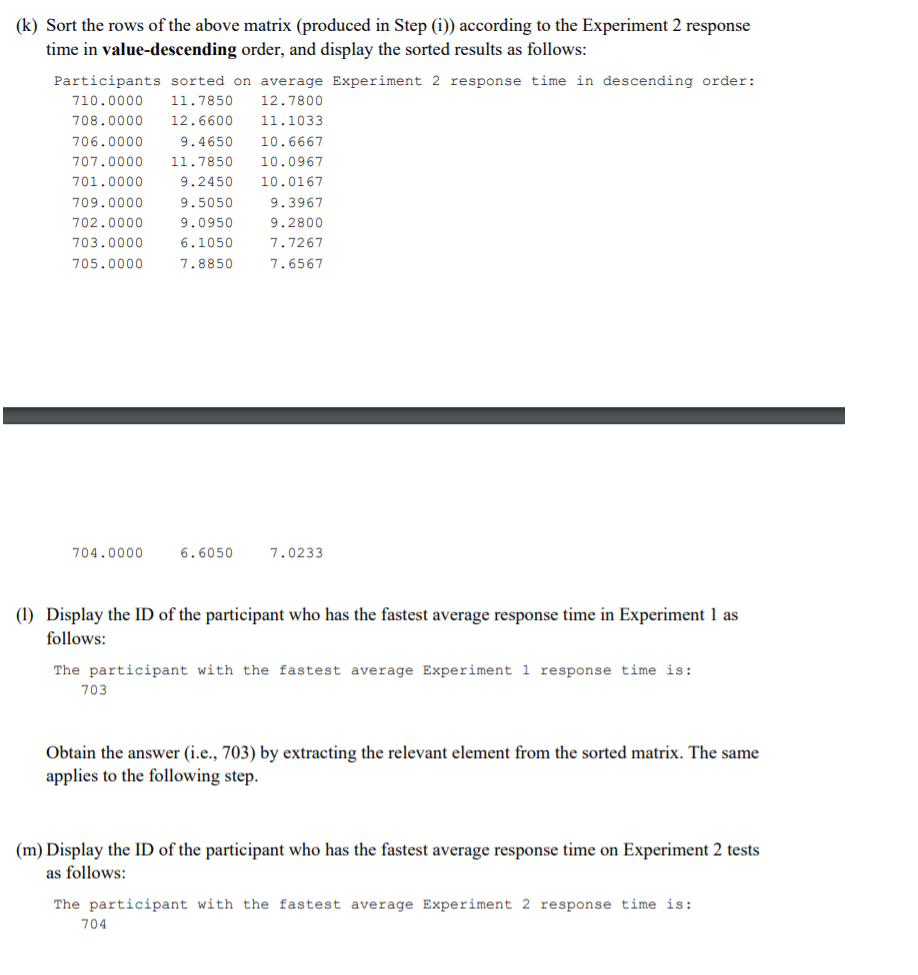
(b) Display the following in the command window: 5. (15 points) Consider the following table that contains the IDs of 10 participants and their response times in seconds) on five tests. There are two experiments, Experiment 1 and Experiment 2, with Tests 1 and 2 belonging to Experiment 1 and Tests 3 to 5 belonging to Experiment 2: | Experiment 2 Test 4 8.69 11.11 8 Participant ID 701 702 703 704 705 706 707 708 709 710 6.97 Experiment 1 Test 1 Test 2 8.62 9.87 8.20 9.99 5.67 6.54 6.45 6.76 7.65 8.12 7.89 11.04 11.23 12.34 12.34 12.98 10.54 8.47 12.34 1 1.23 The response times on five tests of all the participants are: Experiment i Experiment 2 ParticipantID Testi Test2 Test3 Test4 Test 5 701.0000 8.6200 9.8700 11.2300 8.6900 10.1300 702.0000 8.2000 9.9900 8.0300 11.1100 8.7000 703.0000 5.6700 6.5400 7.6500 6.9700 8.5600 704.0000 6.4500 6.7600 7.1200 7.0300 6.9200 705.0000 7.6500 8.1200 7.0900 9.3400 6.5400 706.0000 7.8900 11.0400 10.2800 11.1200 10.6000 707.0000 11.2300 12.3400 9.5600 11.5400 9.1900 708.0000 12.3400 12.980010.9800 9.9900 12.3400 709.0000 10.54008 .4700 9.9600 8.4100 9.8200 710.0000 12.3400 11.2300 12.3400 13.1100 12.8900 Test 3 11.23 .03 7.65 7.12 7.09 10.28 9.56 10.98 9.96 12.34 Test 5 10.13 8.70 8.56 6.92 6.54 10.60 9.19 12.34 9.82 12.89 7.03 9.34 11.12 11.54 9.99 8.41 13.11 (c) Compute the average response time for each test over all the participants. Display the following to the command window: The average response time for Tests 1, 2, 3, 4, and 5 are: 9.0930 9.73409 .4240 9.7310 9.5690 The above data are stored in an Excel file named response time.xlsx. Download this file from the course Moodle and place it in your working directory. Write a MATLAB program (a2q5.m) to do the following in the specified order: (a) Use MATLAB's xlsread command to read the participant IDs and response times in the file response_time.xlsx. Read the data into a matrix RT. Do not type the values into the matrix (d) Compute Pearson's correlation coefficient between Test 1 and Test 2 response times. Output the computed correlation coefficient score to the command window: Correlation coefficient between test 1 and test 2 is: 0.8050 (e) Compute Pearson's correlation coefficient between Test 4 and Test 5 response times. Output the computed correlation coefficient score to the command window: Correlation coefficient between test 4 and test 5 is: 0.5807 (f) Compute the average response time of each participant in Experiment 1 (that is, the average of responses for each participant in Test 1 and Test 2). Send output to the command window: The average response time of each participant in Experiment i tests are: 701.0000 9.2450 702.0000 9.0950 703.0000 6.1050 704.0000 6.6050 705.0000 7.8850 706.0000 9.4650 707.0000 11.7850 708.0000 12.6600 709.0000 9.5050 710.0000 11.7850 (g) Compute the average response time of each participant in Experiment 2 (that is, the average of responses in Test 3, Test 4, and Test 5). Send output to the command window: The average response time of each participant in Experiment 2 tests are: 701.0000 10.0167 702.0000 9.2800 703.0000 7.7267 704.0000 7.0233 705.0000 7.6567 706.0000 10.6667 707.0000 10.0967 708.0000 11.1033 709.0000 9.3967 710.0000 12.7800 (h) Compute Pearson's correlation coefficient between the average response time of participants for Experiment 1 and the average response time of participants in Experiment 2 tests. Send output to the command window: Correlation coefficient between Experiment i average and Experiment 2 average is: 0.8658 (i) Display the IDs of the participants, their average response times in Experiment 1, and their average response times in Experiment 2: ParticipantID Experiment 1 Experiment 2 701.0000 9.2450 10.0167 702.0000 9.0950 9.2800 703.0000 6.1050 7.7267 704.0000 6.6050 7.0233 705.0000 7.8850 7.6567 706.0000 9.4650 10.6667 707.0000 11.7850 10.0967 708.0000 12.6600 11.1033 709.0000 9.5050 9.3967 710.0000 11.7850 12.7800 () Sort the rows of the above matrix (produced in Step (i)) according to the Experiment 1 response time in value-ascending order, and display the sorted results as follows: Participants sorted on average Experiment i response time in ascending order: 703.0000 6.1050 7.7267 704.0000 6.60507.0233 705.0000 7.88507 .6567 702.0000 9.0950 9.2800 701.0000 9.2450 10.0167 706.0000 9.4650 10.6667 709.0000 9.5050 9.3967 707.0000 11.7850 10.0967 710.0000 11.7850 12.7800 708.0000 12.6600 11.1033 (k) Sort the rows of the above matrix (produced in Step (i)) according to the Experiment 2 response time in value-descending order, and display the sorted results as follows: Participants sorted on average Experiment 2 response time in descending order: 710.0000 11.7850 12.7800 708.0000 12.6600 11.1033 706.0000 9.4650 10.6667 707.0000 11.7850 10.0967 701.0000 9.2450 10.0167 709.0000 9.50509.3967 702.0000 9.0950 9.2800 703.0000 6.1050 7.7267 705.0000 7.8850 7.6567 704.0000 6.6050 7.0233 (1) Display the ID of the participant who has the fastest average response time in Experiment 1 as follows: The participant with the fastest average Experiment i response time is: 703 Obtain the answer i.e., 703) by extracting the relevant element from the sorted matrix. The same applies to the following step. (m) Display the ID of the participant who has the fastest average response time on Experiment 2 tests as follows: The participant with the fastest average Experiment 2 response time is: 704 (b) Display the following in the command window: 5. (15 points) Consider the following table that contains the IDs of 10 participants and their response times in seconds) on five tests. There are two experiments, Experiment 1 and Experiment 2, with Tests 1 and 2 belonging to Experiment 1 and Tests 3 to 5 belonging to Experiment 2: | Experiment 2 Test 4 8.69 11.11 8 Participant ID 701 702 703 704 705 706 707 708 709 710 6.97 Experiment 1 Test 1 Test 2 8.62 9.87 8.20 9.99 5.67 6.54 6.45 6.76 7.65 8.12 7.89 11.04 11.23 12.34 12.34 12.98 10.54 8.47 12.34 1 1.23 The response times on five tests of all the participants are: Experiment i Experiment 2 ParticipantID Testi Test2 Test3 Test4 Test 5 701.0000 8.6200 9.8700 11.2300 8.6900 10.1300 702.0000 8.2000 9.9900 8.0300 11.1100 8.7000 703.0000 5.6700 6.5400 7.6500 6.9700 8.5600 704.0000 6.4500 6.7600 7.1200 7.0300 6.9200 705.0000 7.6500 8.1200 7.0900 9.3400 6.5400 706.0000 7.8900 11.0400 10.2800 11.1200 10.6000 707.0000 11.2300 12.3400 9.5600 11.5400 9.1900 708.0000 12.3400 12.980010.9800 9.9900 12.3400 709.0000 10.54008 .4700 9.9600 8.4100 9.8200 710.0000 12.3400 11.2300 12.3400 13.1100 12.8900 Test 3 11.23 .03 7.65 7.12 7.09 10.28 9.56 10.98 9.96 12.34 Test 5 10.13 8.70 8.56 6.92 6.54 10.60 9.19 12.34 9.82 12.89 7.03 9.34 11.12 11.54 9.99 8.41 13.11 (c) Compute the average response time for each test over all the participants. Display the following to the command window: The average response time for Tests 1, 2, 3, 4, and 5 are: 9.0930 9.73409 .4240 9.7310 9.5690 The above data are stored in an Excel file named response time.xlsx. Download this file from the course Moodle and place it in your working directory. Write a MATLAB program (a2q5.m) to do the following in the specified order: (a) Use MATLAB's xlsread command to read the participant IDs and response times in the file response_time.xlsx. Read the data into a matrix RT. Do not type the values into the matrix (d) Compute Pearson's correlation coefficient between Test 1 and Test 2 response times. Output the computed correlation coefficient score to the command window: Correlation coefficient between test 1 and test 2 is: 0.8050 (e) Compute Pearson's correlation coefficient between Test 4 and Test 5 response times. Output the computed correlation coefficient score to the command window: Correlation coefficient between test 4 and test 5 is: 0.5807 (f) Compute the average response time of each participant in Experiment 1 (that is, the average of responses for each participant in Test 1 and Test 2). Send output to the command window: The average response time of each participant in Experiment i tests are: 701.0000 9.2450 702.0000 9.0950 703.0000 6.1050 704.0000 6.6050 705.0000 7.8850 706.0000 9.4650 707.0000 11.7850 708.0000 12.6600 709.0000 9.5050 710.0000 11.7850 (g) Compute the average response time of each participant in Experiment 2 (that is, the average of responses in Test 3, Test 4, and Test 5). Send output to the command window: The average response time of each participant in Experiment 2 tests are: 701.0000 10.0167 702.0000 9.2800 703.0000 7.7267 704.0000 7.0233 705.0000 7.6567 706.0000 10.6667 707.0000 10.0967 708.0000 11.1033 709.0000 9.3967 710.0000 12.7800 (h) Compute Pearson's correlation coefficient between the average response time of participants for Experiment 1 and the average response time of participants in Experiment 2 tests. Send output to the command window: Correlation coefficient between Experiment i average and Experiment 2 average is: 0.8658 (i) Display the IDs of the participants, their average response times in Experiment 1, and their average response times in Experiment 2: ParticipantID Experiment 1 Experiment 2 701.0000 9.2450 10.0167 702.0000 9.0950 9.2800 703.0000 6.1050 7.7267 704.0000 6.6050 7.0233 705.0000 7.8850 7.6567 706.0000 9.4650 10.6667 707.0000 11.7850 10.0967 708.0000 12.6600 11.1033 709.0000 9.5050 9.3967 710.0000 11.7850 12.7800 () Sort the rows of the above matrix (produced in Step (i)) according to the Experiment 1 response time in value-ascending order, and display the sorted results as follows: Participants sorted on average Experiment i response time in ascending order: 703.0000 6.1050 7.7267 704.0000 6.60507.0233 705.0000 7.88507 .6567 702.0000 9.0950 9.2800 701.0000 9.2450 10.0167 706.0000 9.4650 10.6667 709.0000 9.5050 9.3967 707.0000 11.7850 10.0967 710.0000 11.7850 12.7800 708.0000 12.6600 11.1033 (k) Sort the rows of the above matrix (produced in Step (i)) according to the Experiment 2 response time in value-descending order, and display the sorted results as follows: Participants sorted on average Experiment 2 response time in descending order: 710.0000 11.7850 12.7800 708.0000 12.6600 11.1033 706.0000 9.4650 10.6667 707.0000 11.7850 10.0967 701.0000 9.2450 10.0167 709.0000 9.50509.3967 702.0000 9.0950 9.2800 703.0000 6.1050 7.7267 705.0000 7.8850 7.6567 704.0000 6.6050 7.0233 (1) Display the ID of the participant who has the fastest average response time in Experiment 1 as follows: The participant with the fastest average Experiment i response time is: 703 Obtain the answer i.e., 703) by extracting the relevant element from the sorted matrix. The same applies to the following step. (m) Display the ID of the participant who has the fastest average response time on Experiment 2 tests as follows: The participant with the fastest average Experiment 2 response time is: 704


